

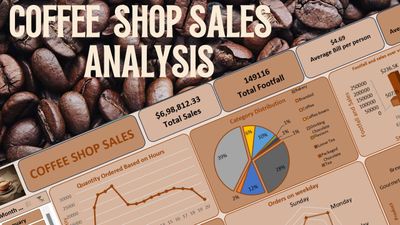
Coffee Shop Sales
Brew Data Into Insights with Coffee Shop Dashboard ☕📊
📊 Coffee Shop Sales Dashboard
This Power BI dashboard provides a comprehensive analysis of a coffee shop's sales performance, designed to offer actionable insights into customer behavior, product trends, and business growth.
🚀 Features
Overview Page
Get a snapshot of key metrics such as total sales, number of transactions, and average revenue per order.Sales Analysis
Break down sales by product categories (e.g., coffee, pastries, tea), identify top-selling items, and compare performance over time.Time-Based Trends
Visualize hourly, daily, and monthly sales patterns to optimize staffing and inventory decisions.Location Insights
Compare performance across multiple store locations or regions.Customer Preferences
Understand which products are most popular and identify customer buying patterns.
🛠️ Tools Used
Power BI Desktop
For data visualization and dashboard creation.DAX
For calculated metrics and measures.Power Query (M Language)
For data transformation and modeling.
📌 Use Case
Perfect for coffee shop owners, retail managers, or analysts looking to:
Monitor daily performance
Identify best-selling products
Optimize business operations
Improve decision-making with data
Built with