Our approach to slow performance debugging
The Incident Triage Nightmare
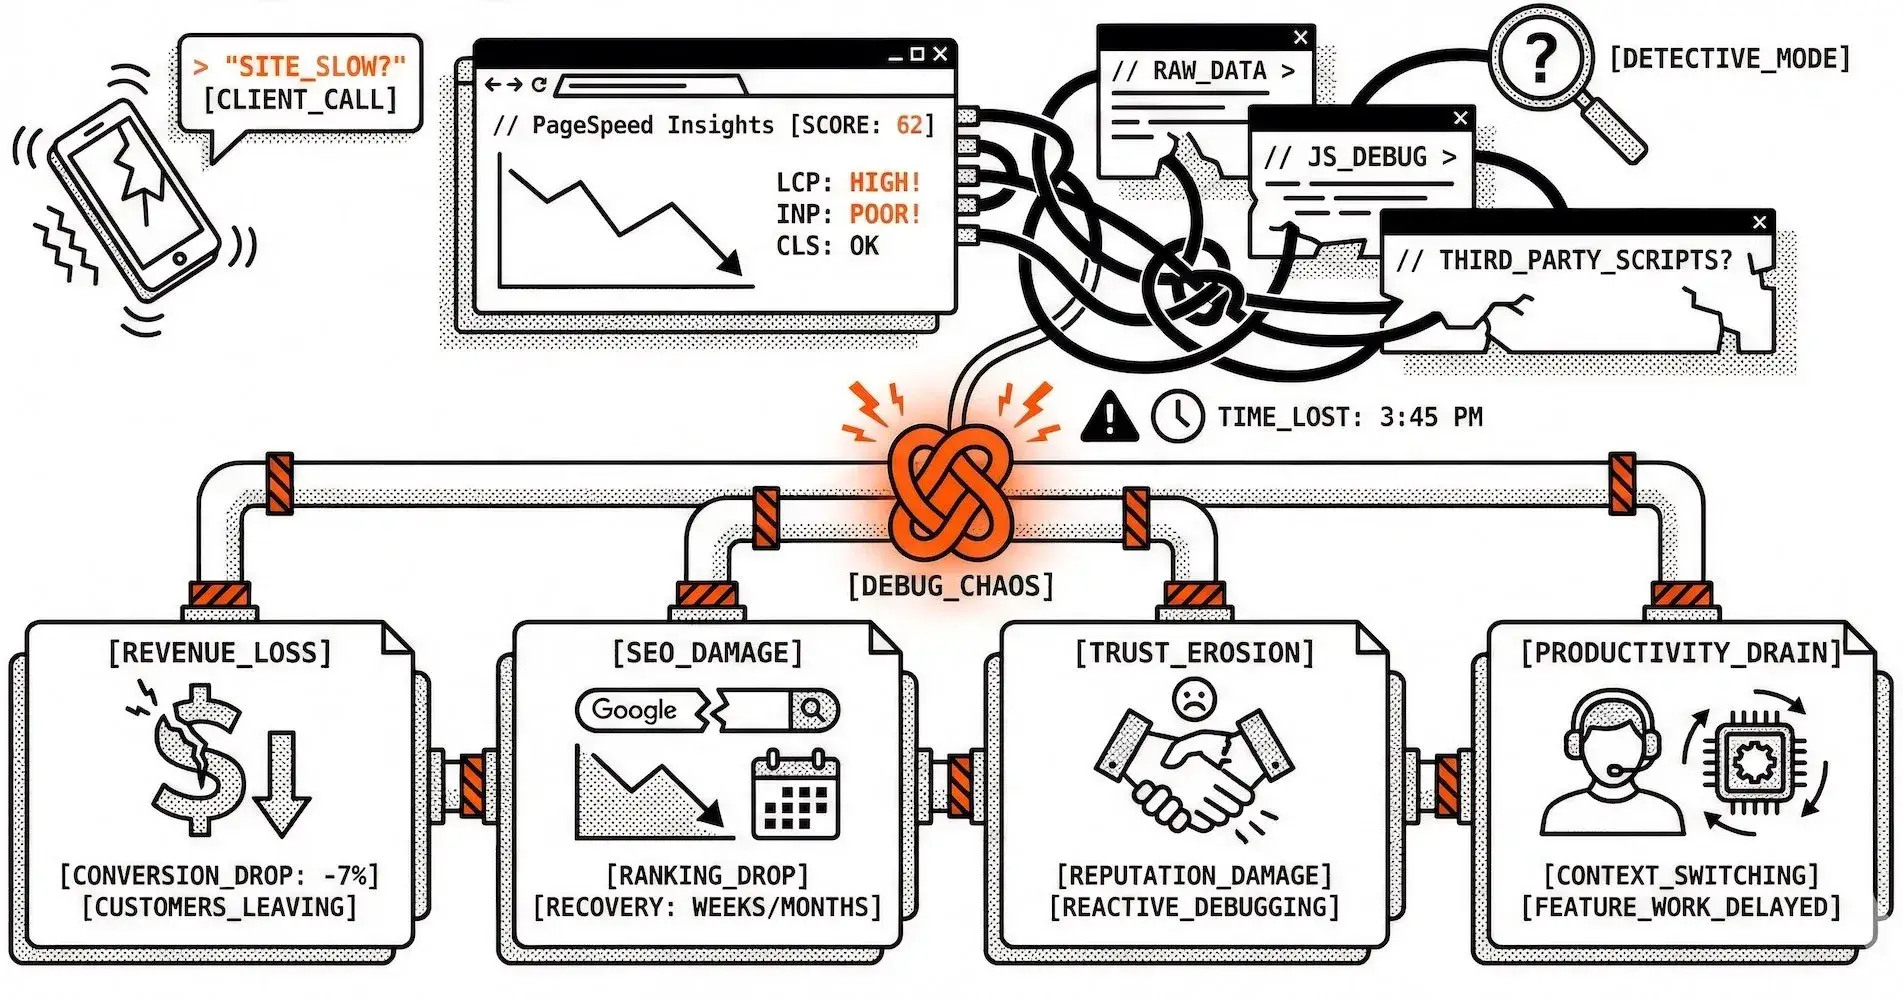
It's 3 PM on a Friday. Your client calls: "The site feels slow. Can you check what's wrong?"
You open PageSpeed Insights, run a test, and see the performance score has dropped from 85 to 62. But why? The metrics show LCP is high, INP is poor, CLS is fine. You need to dig deeper, but where do you start?
You check the raw PageSpeed data, scroll through recommendations, try to correlate the issues. Maybe it's images? Or JavaScript? Could be a third-party script that was added recently. You're playing detective, and every minute you spend debugging is a minute your client's users are experiencing poor performance.
This is the slow performance debugging problem, and it's costing you credibility and revenue.
The Business Impact of Slow Debugging
When performance issues take too long to diagnose, the costs add up quickly:
Revenue Loss
Every second of poor performance impacts conversion rates
Studies show a 1-second delay can reduce conversions by 7%
While you're debugging, potential customers are leaving
SEO Damage
Google's Core Web Vitals directly impact search rankings
Poor performance scores can take weeks or months to recover
The longer issues persist, the deeper the ranking impact
Client Trust Erosion
Slow response to performance issues damages your reputation
Clients expect proactive monitoring, not reactive debugging
Each incident that takes hours to resolve erodes confidence
Team Productivity Drain
Developers pulled away from feature work to debug performance
Context switching between tools and data sources
Time spent on investigation instead of optimization
The Watcher Approach: Faster Diagnosis
We're building Watcher to turn slow debugging into faster diagnosis. Here's how:
Test Results with Context
When Watcher runs tests, you get more than a score:
Metric breakdown for LCP, INP, CLS, and other Core Web Vitals
Stored test history so you can see how metrics change over time
Raw PageSpeed data when you need to dig deeper
Recommendations from the test data to guide fixes
Budget Alerts That Record What Mattered
Watcher records budget violations as alerts so you have a clear audit trail:
Which metrics exceeded your thresholds
Which pages and strategies (mobile/desktop) are affected
Test results linked to each alert for immediate context
Email and Slack notifications are on our roadmap so you'll be notified where you already work; until then, alerts are visible in the Watcher admin alongside your test history.
Integrations (Coming Soon)
We're building integrations with the tools you use:
Email and Slack for alert notifications
Webhooks for custom workflows
API access for automation and headless dashboards
Example: From Violation to Fix
A typical flow with Watcher:
Budget is exceeded: Watcher records an alert (e.g. LCP over threshold on the homepage).
Review in Watcher: Open the site and page, see test results and when scores dropped.
Use the data: Check the metric breakdown and recommendations, identify the cause (e.g. a new unoptimized image).
Fix and confirm: Deploy the fix, run a new test from the admin, and confirm the improvement.
Everything stays in one place—no juggling multiple tools or dashboards.
Performance Budgets: Know When Thresholds Are Breached
Watcher's performance budget system lets you set thresholds per site and strategy:
Set maximum values for LCP, INP, CLS, and other Core Web Vitals
Get alerts recorded when budgets are exceeded
Review which pages and metrics are affected from the admin
Use budgets to focus optimization on what matters most
Historical Data for Smarter Debugging
Watcher stores test results over time so you can:
See how metrics change across test runs
Spot trends and regressions from the same place you view alerts
Avoid re-downloading or re-running tests just to compare
We're adding comparison views and deployment correlation so you can tie changes to releases and build a clearer picture of what works.
What This Means for Your Workflow
With Watcher today, you can:
See the full picture in one place: test results, budgets, and alerts in the admin
Catch threshold breaches via recorded alerts and linked test data
Use stored history to see when scores dropped and what changed
Scale monitoring across multiple sites without juggling multiple tools
The Future of Performance Diagnostics
As we continue building Watcher, we're adding capabilities that will make debugging even faster:
Email and Slack notifications for budget violations
AI-assisted root cause analysis
Correlation with deployment history
CI/CD integrations for pre-deployment checks
Predictive alerts based on trend analysis
The goal is to make performance debugging so fast and accurate that issues are resolved before users notice them.
Join Markos on Peerlist!
Join amazing folks like Markos and thousands of other builders on Peerlist.
0
2
0