Reports people read: Addressing limited stakeholder visibility
The Translation Problem
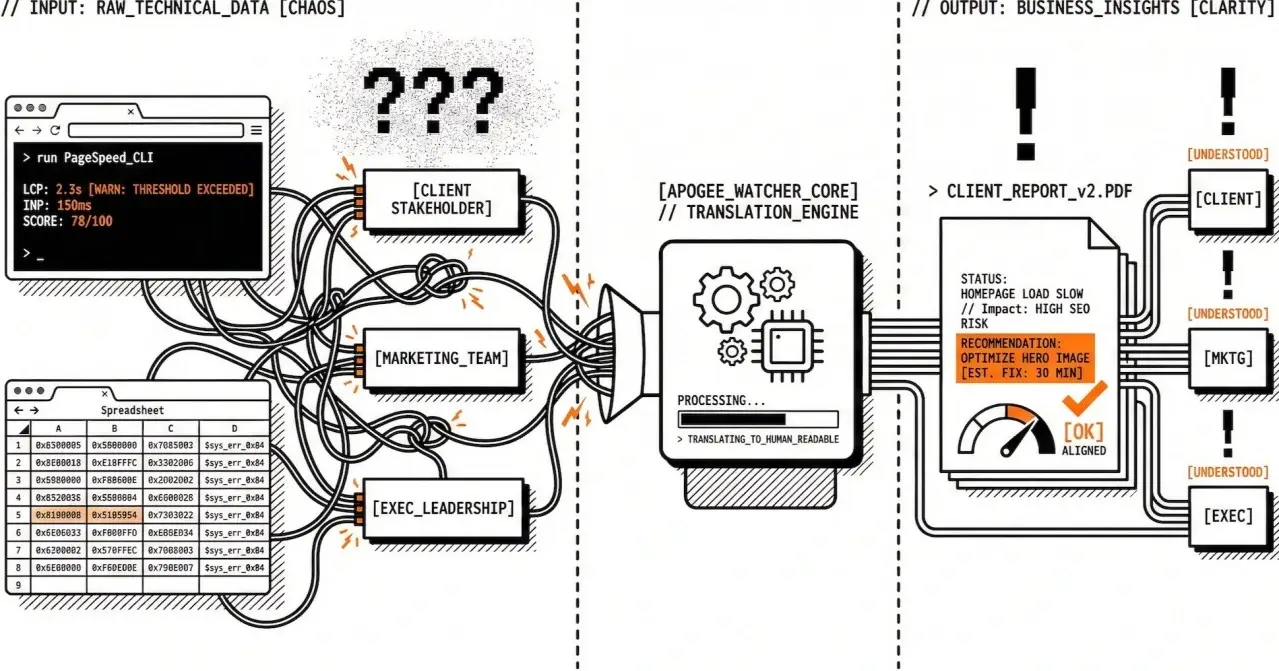
You've just run a PageSpeed test, and the results are in: Performance score 78, LCP at 2.3 seconds, INP at 150ms. You know what these numbers mean, but when you try to explain them to your client or your marketing team, you're met with blank stares.
"Is 78 good or bad?" "What's LCP again?" "Why should I care about INP?"
This is the stakeholder visibility problem. Technical metrics don't translate to business impact, and when stakeholders can't understand performance data, they can't make informed decisions.
The Cost of Poor Communication
When performance data isn't accessible to non-technical stakeholders, the business suffers:
Missed Opportunities
Marketing teams don't understand how performance affects SEO
Executives can't prioritise performance improvements
Clients don't see the value in optimisation work
Budget requests for performance improvements get denied
Misaligned Priorities
Technical teams optimise metrics that don't matter to business goals
Business teams make decisions without understanding performance implications
No shared understanding of what "good performance" means
Trust Issues
Clients feel left out of the performance conversation
Reports full of technical jargon create confusion, not confidence
Performance issues surprise stakeholders who thought everything was fine
Inefficient Workflows
Developers spend time creating custom reports for different audiences
Multiple versions of the same data for different stakeholders
Time lost translating technical metrics into business language
The Apogee Watcher Approach: Human-Readable Performance
We're building Apogee Watcher to bridge the gap between technical metrics and business understanding:
Plain Language Reporting
Apogee Watcher reports translate technical metrics into business language:
Instead of "LCP: 2.3s", you see "Page loads in 2.3 seconds (target: under 2.5s)"
Performance scores come with clear labels: "Good", "Needs Improvement", "Poor"
Recommendations are written for non-technical audiences
Visual charts show trends without requiring metric knowledge
Role-Based Dashboards
Different stakeholders have different views:
Executives see high-level KPIs and trends
Marketing teams see SEO impact and user experience metrics
Developers see detailed technical metrics and recommendations
Clients see their site's performance in business terms
Automated Client Reports
Apogee Watcher generates client-ready reports that:
Use plain language explanations
Focus on business impact, not technical details
Include visual charts and comparisons
Highlight improvements and areas for optimisation
Support white-label branding for agencies
Sharing and Collaboration
Apogee Watcher makes it easy to share performance data:
Generate shareable report links with expiration dates
Export PDFs optimised for client presentations
Set up automated weekly or monthly reports
Control what data each stakeholder can see
Example: From Technical Metric to Business Story
Here's how Apogee Watcher transforms a technical metric into a business insight:
Technical View: "LCP increased from 1.8s to 2.4s, exceeding the 2.5s threshold."
Business View: "Homepage load time increased by 33% this week. This could impact search rankings and user experience. The main issue is a large hero image that needs optimisation. Estimated fix time: 30 minutes. Expected improvement: Return to previous performance levels."
The business view answers: What happened? Why does it matter? What can we do? How long will it take?
Performance Briefs for Leadership
Apogee Watcher can generate executive briefs that:
Summarise performance across all sites in one page
Highlight critical issues requiring attention
Show trends and improvements over time
Provide actionable recommendations with business impact
Client Portal Access
For agencies, Apogee Watcher provides client portal features:
Clients can view their site's performance dashboard
Automated reports sent on a schedule
Performance improvements tracked and highlighted
White-label branding so reports look like they came from your agency
What This Means for Your Team
With Apogee Watcher's stakeholder visibility features, you can:
Communicate effectively with non-technical stakeholders
Save time by generating reports automatically
Build trust with transparent, accessible performance data
Align priorities across technical and business teams
The Future of Performance Communication
As we continue building Apogee Watcher, we're adding features to improve stakeholder visibility:
Custom report templates for different audiences
Automated insights that explain performance in business terms
Integration with business intelligence tools
Performance impact calculators (e.g., "This improvement could increase conversions by X%")
The goal is to make performance data as accessible and actionable for business stakeholders as it is for technical teams.
Join Markos on Peerlist!
Join amazing folks like Markos and thousands of other builders on Peerlist.
0
1
0