The Fragmented Monitoring Problem
The Dashboard Sprawl
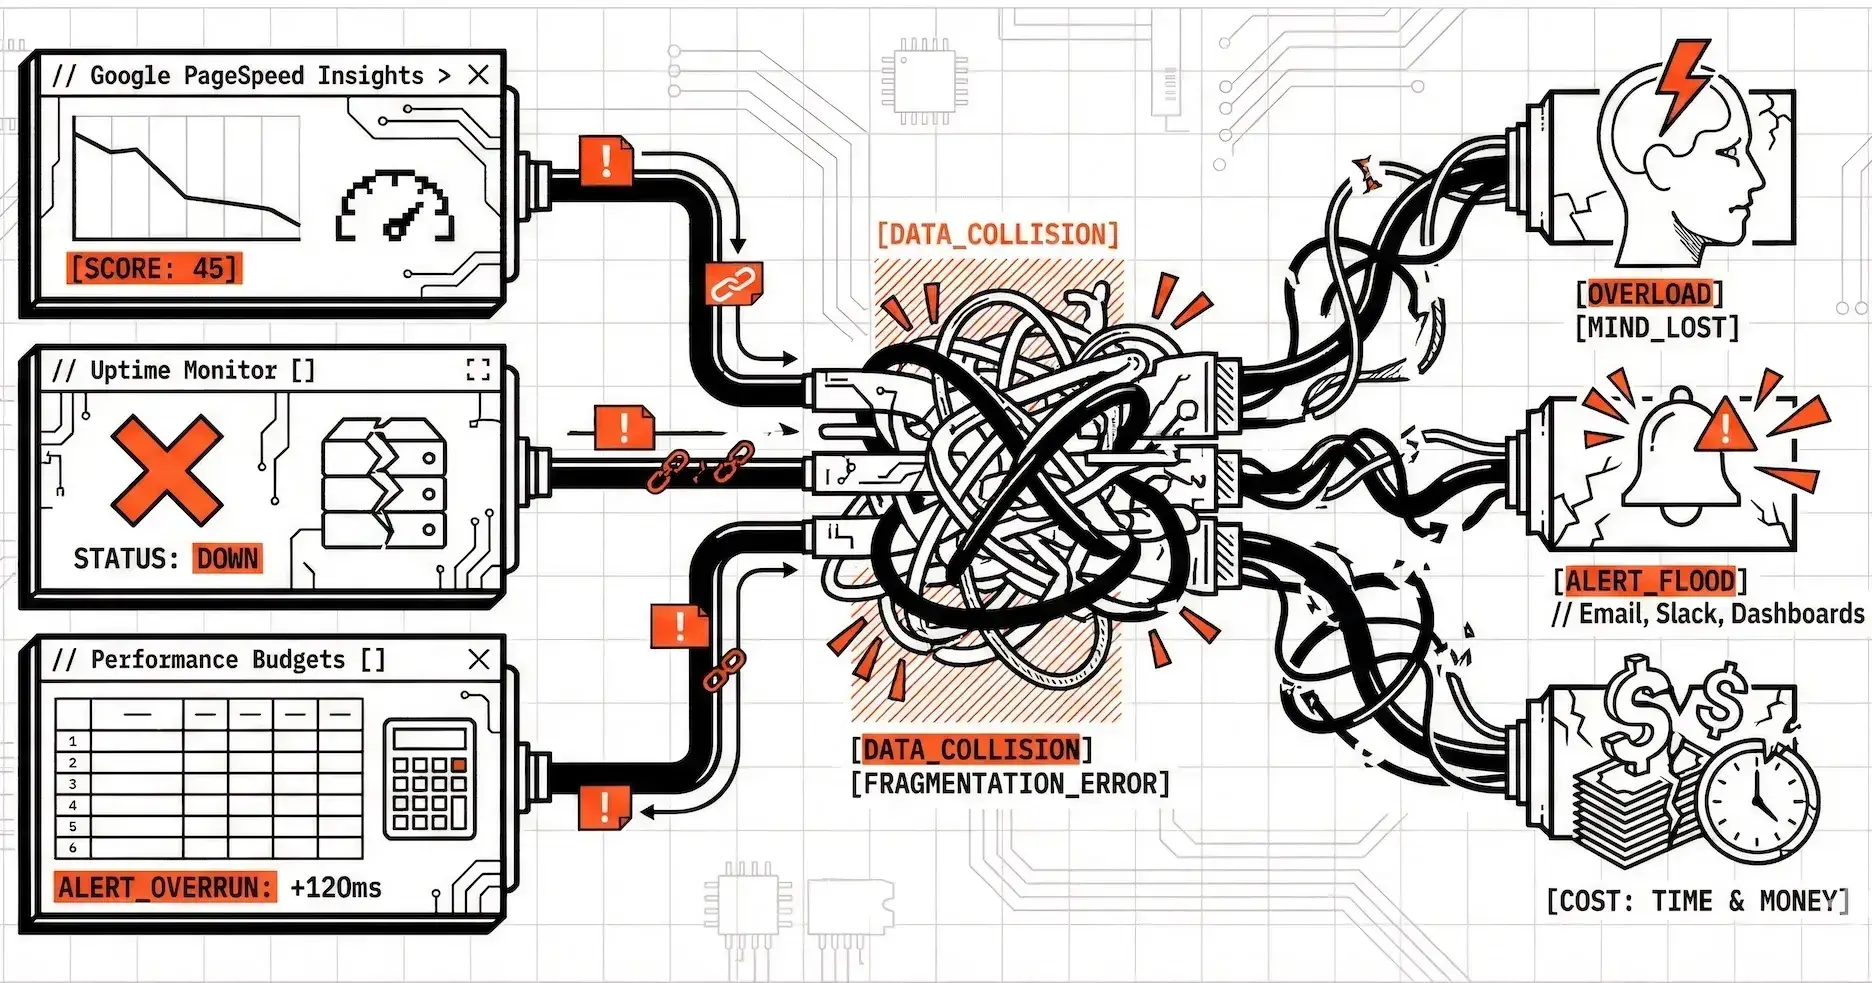
You know the drill. You have Google PageSpeed Insights open in one tab, checking scores manually. Your uptime monitoring tool in another. Performance budgets tracked in a spreadsheet. Alert notifications scattered across email, Slack, and various tool dashboards. Each tool does one thing well, but getting a complete picture of your website's performance requires juggling half a dozen different interfaces.
This is the fragmented monitoring problem, and it's costing you time, money, and peace of mind.
The Real Cost of Fragmentation
When your monitoring tools don't talk to each other, you're not just dealing with inconvenience—you're dealing with real business impact:
Time Lost in Context Switching
Jumping between dashboards breaks your workflow
No single source of truth means you're constantly cross-referencing data
Important issues slip through the cracks between tools
Inconsistent Alerting
Different tools have different alert thresholds
Some tools are too sensitive, others too quiet
You end up either drowning in notifications or missing critical issues
Incomplete Picture
PageSpeed scores in one place, uptime in another, user analytics somewhere else
No unified view of how all these metrics relate to each other
Hard to correlate performance issues with business impact
Client Communication Challenges
Pulling data from multiple sources to create reports
Inconsistent formatting makes you look unprofessional
Time spent on report assembly instead of actual optimization
The Apogee Watcher Approach: Unified Observability
We're building Apogee Watcher to be your single source of truth for performance monitoring. Here's how we're addressing the fragmentation problem:
One Dashboard, All Your Sites
Instead of logging into multiple tools, Apogee Watcher gives you a unified dashboard where you can see:
Performance scores across all your monitored sites
Recent test results and trends
Active alerts and issues requiring attention
API usage and quota management
Consistent Alerting Strategy
Apogee Watcher uses a unified alerting system where you can:
Set performance budgets that apply consistently across all sites
Configure alert thresholds once and have them work everywhere
Choose your notification channels (email, Slack, webhooks) per organization
Get smart cooldowns to prevent alert fatigue
Automated Discovery and Testing
Apogee Watcher automatically discovers pages from your sitemaps and route scanning, so you don't need to manually configure monitoring in multiple places. Once a site is added, Apogee Watcher handles the rest.
Integrated Reporting
Generate comprehensive reports that pull from all your monitoring data in one place. No more copying and pasting from different tools—Apogee Watcher assembles everything into client-ready PDFs automatically.
What This Means for You
With unified monitoring, you can:
Save hours each week by eliminating context switching between tools
Catch issues faster with consistent alerting across all sites
Present a professional image with integrated reporting
Scale your monitoring without scaling your tooling complexity
The Future of Unified Monitoring
As we continue building Apogee Watcher, we're planning integrations that will bring even more data sources into the unified view:
Uptime monitoring integration
Real user monitoring (RUM) data
CDN and hosting provider metrics
Custom webhook endpoints for your existing tools
The goal is simple: one place to see everything that matters about your websites' performance.
Join Markos on Peerlist!
Join amazing folks like Markos and thousands of other builders on Peerlist.
0
2
0