What Are Core Web Vitals? A Practical Guide for 2026
What Google Actually Measures
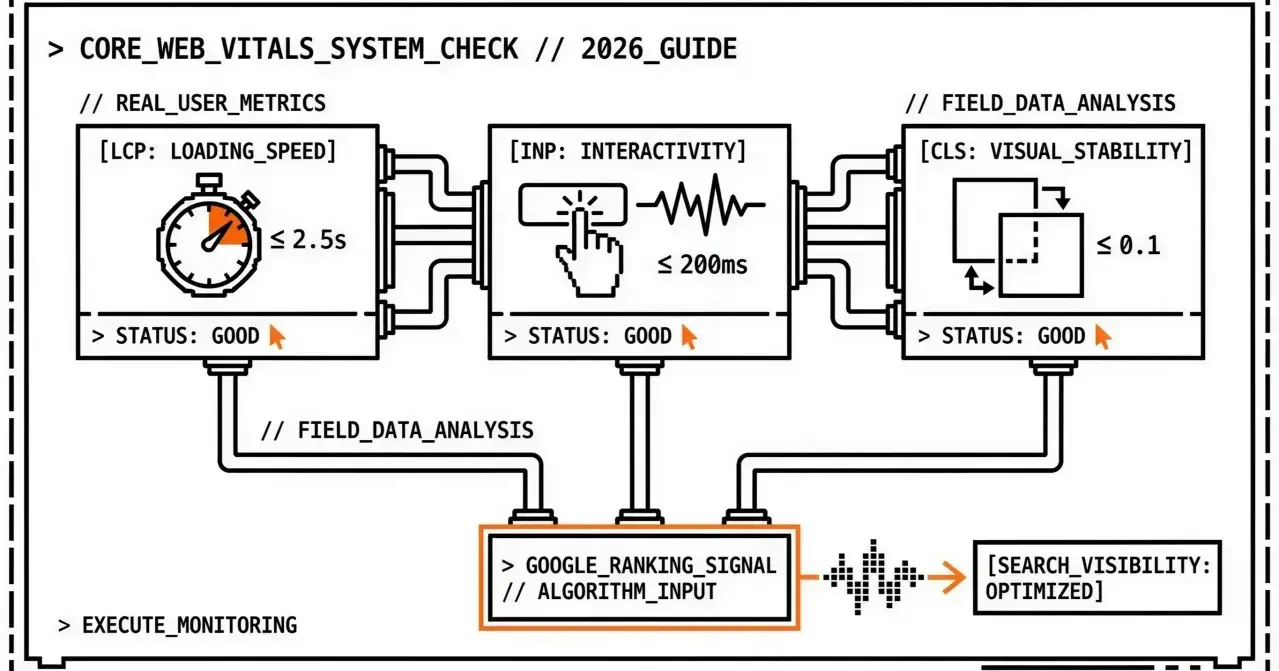
Core Web Vitals are a set of specific metrics that Google uses to evaluate the real-world user experience of a web page. They're not theoretical benchmarks — they're based on how actual users experience your site in the field.
As of 2026, three metrics make up Core Web Vitals:
LCP (Largest Contentful Paint) — How fast the main content loads
INP (Interaction to Next Paint) — How responsive the page is to user input
CLS (Cumulative Layout Shift) — How visually stable the page is during loading
These three metrics replaced older measures (like FID, which INP succeeded in March 2024) and represent what Google considers the most important aspects of user experience: loading speed, interactivity, and visual stability.
Why Core Web Vitals Matter
Core Web Vitals matter for two concrete reasons:
1. They Directly Affect Search Rankings
Google confirmed that Core Web Vitals are a ranking signal. Pages that meet the "Good" thresholds get a ranking advantage over pages that don't. This isn't speculation — it's part of Google's documented page experience signals.
The impact is real but proportional. CWV won't override great content and strong backlinks, but when two pages compete for the same keyword with similar content quality, the one with better CWV will rank higher.
2. They Correlate With Business Outcomes
The metrics Google chose aren't arbitrary. They measure things users actually care about:
Slow loading (poor LCP) = users leave before seeing your content
Unresponsive pages (poor INP) = users abandon forms and interactions
Layout shifts (poor CLS) = users misclick, lose trust, and bounce
Studies consistently show that improving these metrics improves conversion rates, time on site, and user satisfaction.
The Three Metrics Explained
LCP — Largest Contentful Paint
What it measures: The time it takes for the largest visible content element (usually a hero image, video, or large text block) to finish rendering.
Thresholds:
Good: ≤ 2.5 seconds
Needs Improvement: 2.5 – 4.0 seconds
Poor: > 4.0 seconds
Common causes of poor LCP:
Slow server response times (TTFB)
Render-blocking JavaScript and CSS
Large, unoptimized images
Slow resource load times from CDN or third-party origins
Quick wins:
Compress and serve images in modern formats (WebP, AVIF)
Preload the LCP resource with <link rel="preload">
Reduce server response time
Remove unused CSS and JavaScript
INP — Interaction to Next Paint
What it measures: The responsiveness of the page to user interactions. INP captures the delay between a user action (click, tap, keypress) and the next visual update. It considers all interactions during the page's lifecycle and reports a value close to the worst case.
Thresholds:
Good: ≤ 200 milliseconds
Needs Improvement: 200 – 500 milliseconds
Poor: > 500 milliseconds
Common causes of poor INP:
Heavy JavaScript execution blocking the main thread
Long tasks (> 50ms) triggered by event handlers
Large DOM trees requiring expensive layout recalculations
Third-party scripts competing for main thread time
Quick wins:
Break long tasks into smaller chunks using requestIdleCallback or scheduler.yield()
Defer non-critical JavaScript
Reduce DOM size and complexity
Audit and limit third-party script impact
CLS — Cumulative Layout Shift
What it measures: The total amount of unexpected layout movement during the page's lifetime. Every time an element shifts position without user interaction (like an ad loading and pushing content down), it contributes to CLS.
Thresholds:
Good: ≤ 0.1
Needs Improvement: 0.1 – 0.25
Poor: > 0.25
Common causes of poor CLS:
Images and videos without explicit width/height dimensions
Ads, embeds, and iframes without reserved space
Dynamically injected content above existing content
Web fonts causing FOIT/FOUT (Flash of Invisible/Unstyled Text)
Quick wins:
Always set width and height attributes on images and videos
Reserve space for ad slots and embeds with CSS aspect-ratio or min-height
Use font-display: swap with fallback font size matching
Avoid inserting content above existing visible content
How to Check Your Core Web Vitals
Lab Data vs Field Data
There are two types of CWV data, and understanding the difference matters:
Lab data is collected in a controlled environment (like running a Lighthouse test). It's useful for debugging but doesn't reflect real user experience.
Field data is collected from actual users visiting your site (via the Chrome User Experience Report). This is what Google uses for ranking decisions.
Important caveat: Field data requires sufficient traffic. Pages with fewer than a few hundred monthly Chrome users may not have CrUX data. For low-traffic pages (new sites, long-tail blog posts, staging), lab data is your only source — and that's fine for debugging. Prioritize field data for high-traffic, conversion-critical pages.
You need both: lab data to find and fix issues, field data to verify the impact (when available).
Tools for Checking CWV
Google PageSpeed Insights — Shows both lab and field data for any URL. This is the most straightforward tool for a quick check.
Google Search Console — The Core Web Vitals report shows field data across your entire site, grouped by status.
Chrome DevTools — Performance panel provides detailed lab measurements.
web.dev/measure — Quick lab test with Lighthouse scoring.
CrUX Dashboard — Historical field data trends via BigQuery or the CrUX API.
Automated Monitoring
Checking CWV manually works for a single page, but it doesn't scale. If you manage multiple sites or need to track performance over time, you need automated monitoring that:
Runs tests on a schedule (daily, weekly)
Tracks trends across all your pages
Alerts you when metrics cross thresholds
Generates reports for stakeholders
This is exactly what tools like Apogee Watcher are built to do — automate PageSpeed testing across multiple sites and alert you when Core Web Vitals degrade. Apogee Watcher displays both lab and field data in every test result, so you get the full picture: Lighthouse metrics for debugging and CrUX real-user metrics for understanding what Google sees. For a deeper dive on each metric, see our Core Web Vitals guides; for setting thresholds, see our performance budget resources.
Core Web Vitals and Mobile vs Desktop
Google evaluates CWV separately for mobile and desktop. A page can pass on desktop but fail on mobile (or vice versa). Since Google uses mobile-first indexing, your mobile CWV scores are typically more important for rankings.
Key differences:
Mobile devices have less processing power, making INP scores generally worse
Mobile connections are often slower, impacting LCP
Smaller screens amplify layout shifts, making CLS more noticeable
Always test and monitor both strategies. Don't assume desktop scores reflect mobile experience.
Setting Performance Budgets
Once you understand what "Good" means for each metric, you can set performance budgets — maximum acceptable values for each metric on each page. A starting point:

Performance budgets give your team a concrete target and make it easy to spot regressions. When a metric exceeds its budget, you know something changed and needs attention.
Where to Start (If You're Overwhelmed)
If you're new to CWV and don't know where to begin:
Run PageSpeed Insights on your homepage — Mobile and desktop. Note which metric is worst (LCP, INP, or CLS).
Fix the worst one first — LCP usually has the biggest impact and is often the easiest (images, server, preload).
Don't aim for perfection on day one — Moving from "Poor" to "Needs Improvement" is progress. Then tighten further.
Monitor your top 5 pages — Homepage plus your highest-traffic or highest-conversion pages. Ignore the long tail until the key pages are solid.
What's Next
Core Web Vitals will continue to evolve. Google has already replaced FID with INP and may introduce new metrics as web technology changes. The best strategy is to build a monitoring habit now:
Measure your current CWV scores across all pages
Set budgets based on the "Good" thresholds
Monitor continuously with automated tools
Fix issues as they arise, before they impact rankings
Report performance to stakeholders regularly
The agencies and teams that treat CWV as an ongoing practice — not a one-time fix — are the ones that maintain strong search visibility.
FAQ
Are Core Web Vitals the only ranking factor? No. CWV are one of many ranking signals. Content relevance, backlinks, and overall page experience still matter significantly. But CWV can be the tiebreaker between competing pages.
How often does Google update CWV data? Field data in the Chrome User Experience Report (CrUX) is updated monthly with a rolling 28-day window. Changes to your site take about a month to reflect in field data.
Do all pages need to pass CWV? Google evaluates CWV at the page level and groups pages by similar URL patterns. Not every page needs to be perfect, but your key landing pages and high-traffic pages should meet "Good" thresholds.
What replaced FID? INP (Interaction to Next Paint) replaced FID as a Core Web Vital in March 2024. INP is a better measure of overall page responsiveness because it considers all interactions, not just the first one.
Want automated Core Web Vitals monitoring for all your sites? Join the Apogee Watcher waitlist for early access to multi-site PageSpeed monitoring with alerts and reports.
Join Markos on Peerlist!
Join amazing folks like Markos and thousands of other builders on Peerlist.
0
5
0