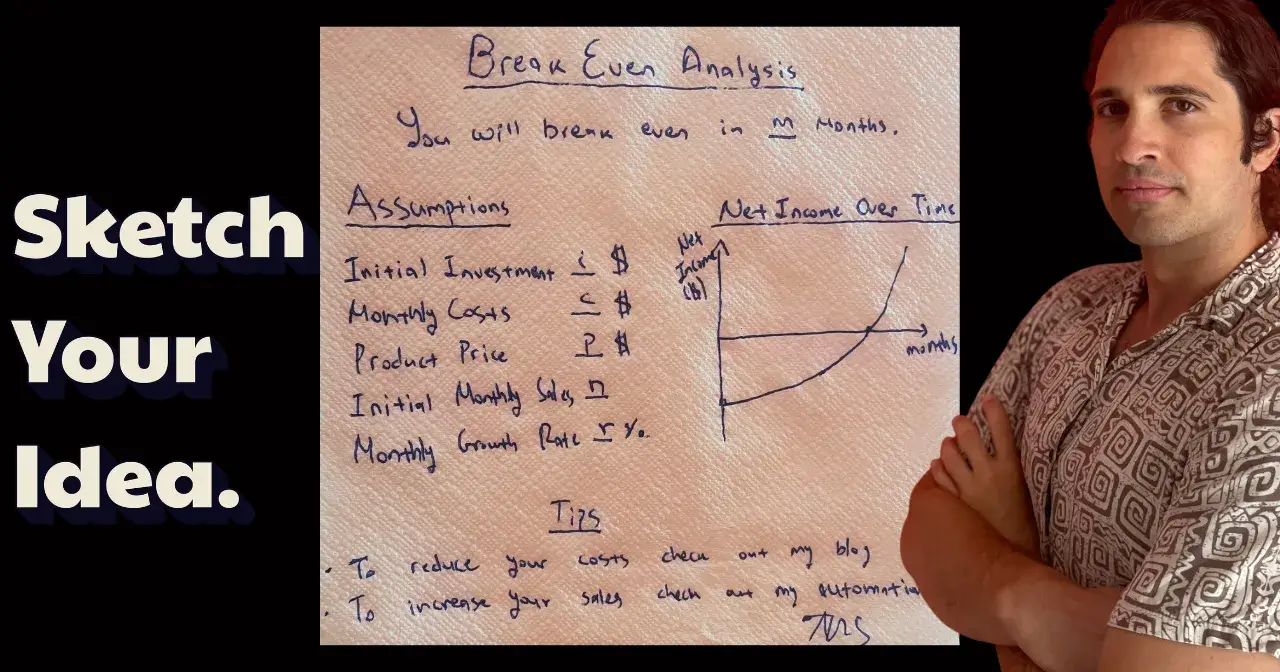
from paper napkin to website
using lovable
interfaces rule our lives
Remember the early days of ChatGPT? What stood out?
Essays and code were generated in minutes, just by typing.
The speed at which we created usable output was remarkable.
A future in which innovative user interfaces make AI more accessible and interactive, awaits.
What are some unexplored interfaces that we can leverage now?
Enter the Paper Napkin Test
Being able to depict a product on a paper napkin is a proof of concept and skill.
This post will break down the generation of an idea, its sketch, and eventual implementation to a fully functioning website in minutes. Specifically, we’ll create a break even analysis chart using Lovable.
Our toolkit.
A clear idea of a product.
Pen and napkin.
Phone camera.
Internet.
Product Ideation
A sketch reflects one’s clarity of thinking.
I need to easily project the break even point for my products. Furthermore, I will focus on one-time revenue products vs subscription products, which have churn rates and can complicate the math, and hence design.
While my design is a drastic simplification, it still provides a reality check.
We can always improve later.
Remember, perfection is the enemy of good.
Pen and Napkin
This is where vision meets craftsmanship.
A napkin has physical boundaries and a steady hand is needed.
Here I recommend you channel your target audience’s psychology.
I am targeting busy people with a low attention span that will pick up on things quickly.
They need quick answers and simple options for scenario planning.
That means a clean header to start, which outlines the months after which one breaks even.
Followed by a clear depiction of the financial assumptions. Next to these assumptions, we want illustrate the path to profitability.
Here’s our final product.
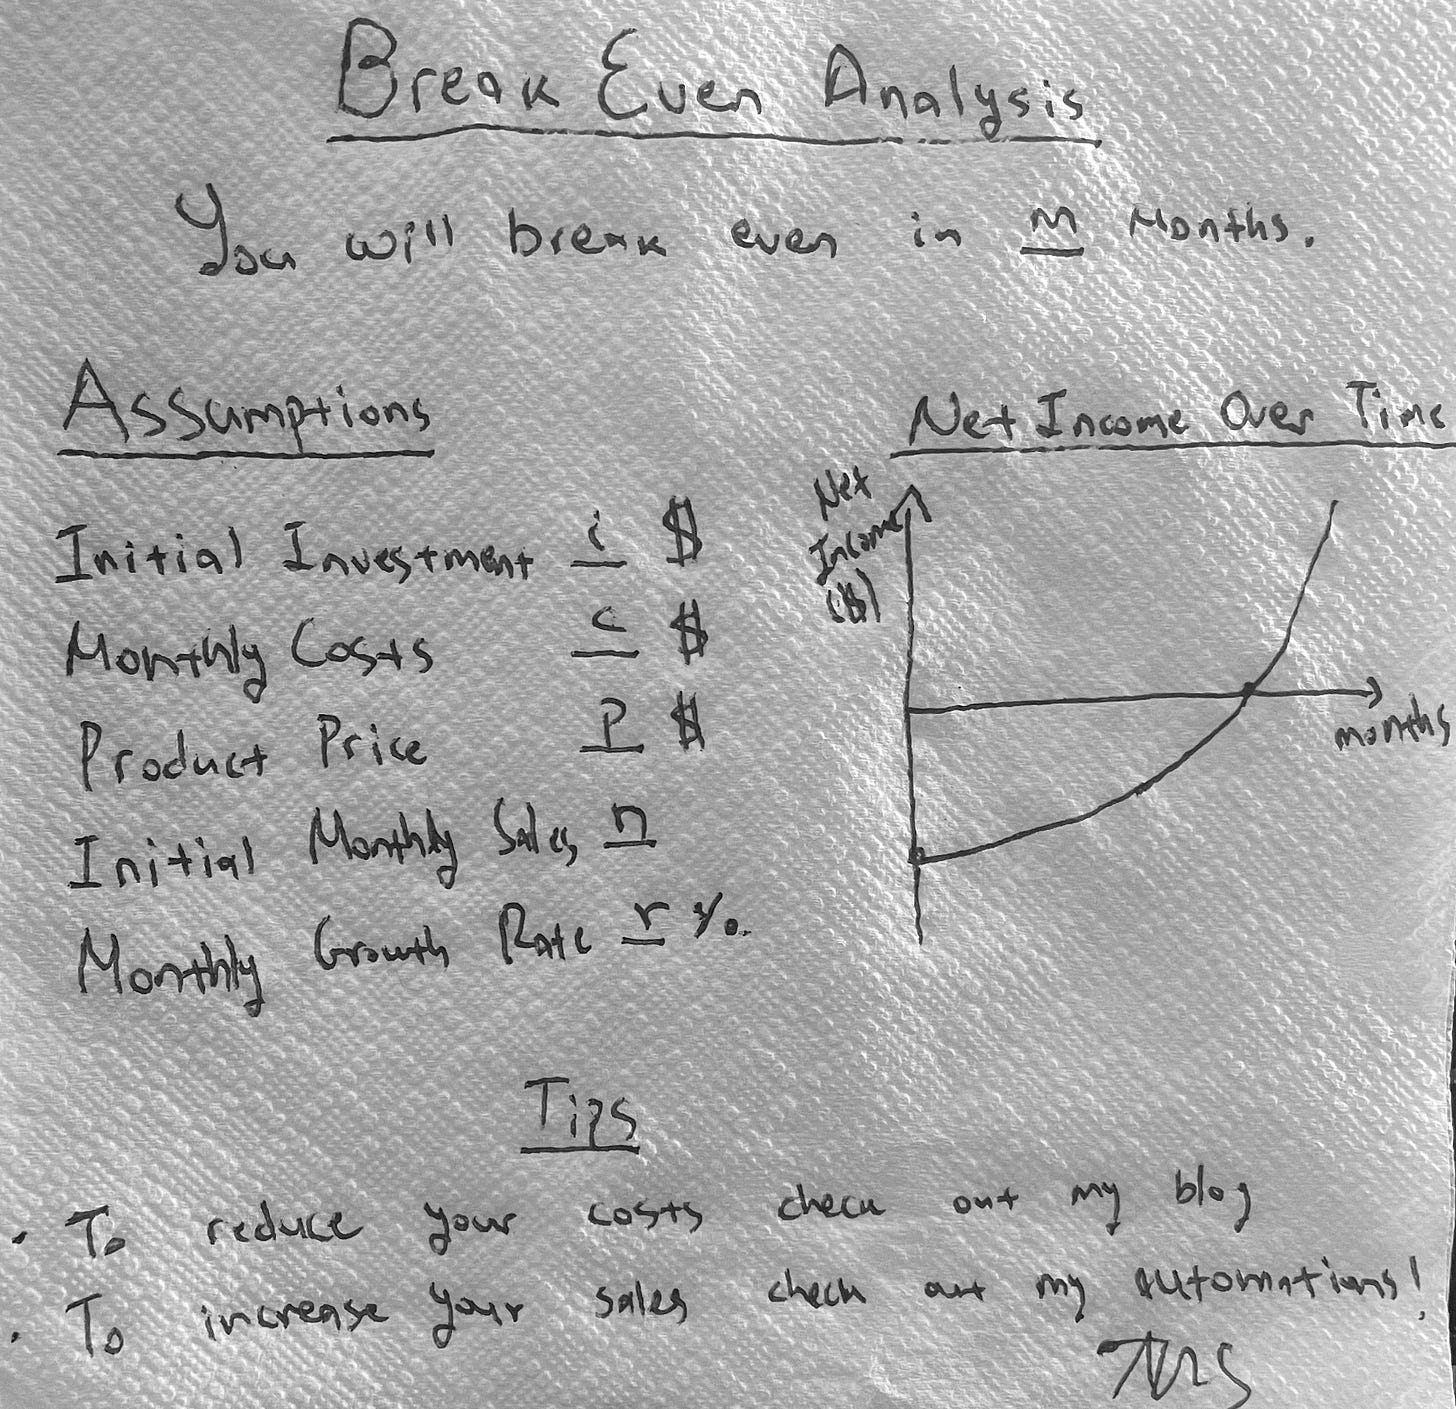
Design of a break even analysis chart tool
In the video below, I show you how I did it.
Lights, Camera, Action
Just snap this image and keep it for your records.
I have also saved it in my POSE repo, where I collect a list of practical one shot evaluations of LLM. More about them below.
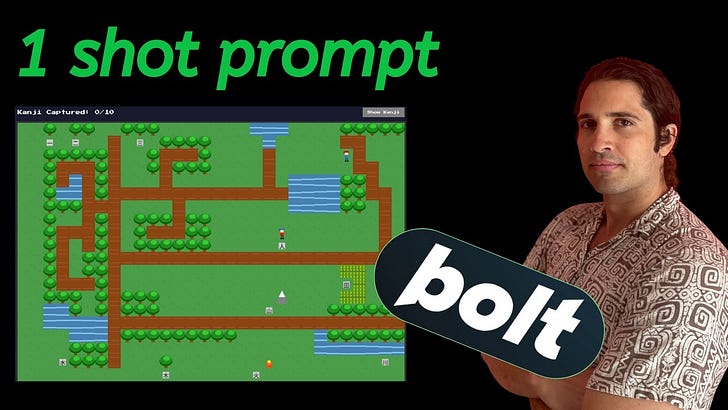
Pushing 1 Shot Prompts to the Limit
Lovable
This is one of many platforms that you can experiment. They have a generous free tier, so check them out.
My prompt is mentioned below.
Create this break even analysis chart tool
exactly as shown in the attached image
please use brand colors from the Mercury Bank screenshot
It’s very simple, right ?
I also provide the screenshot from Mercury Bank, below.
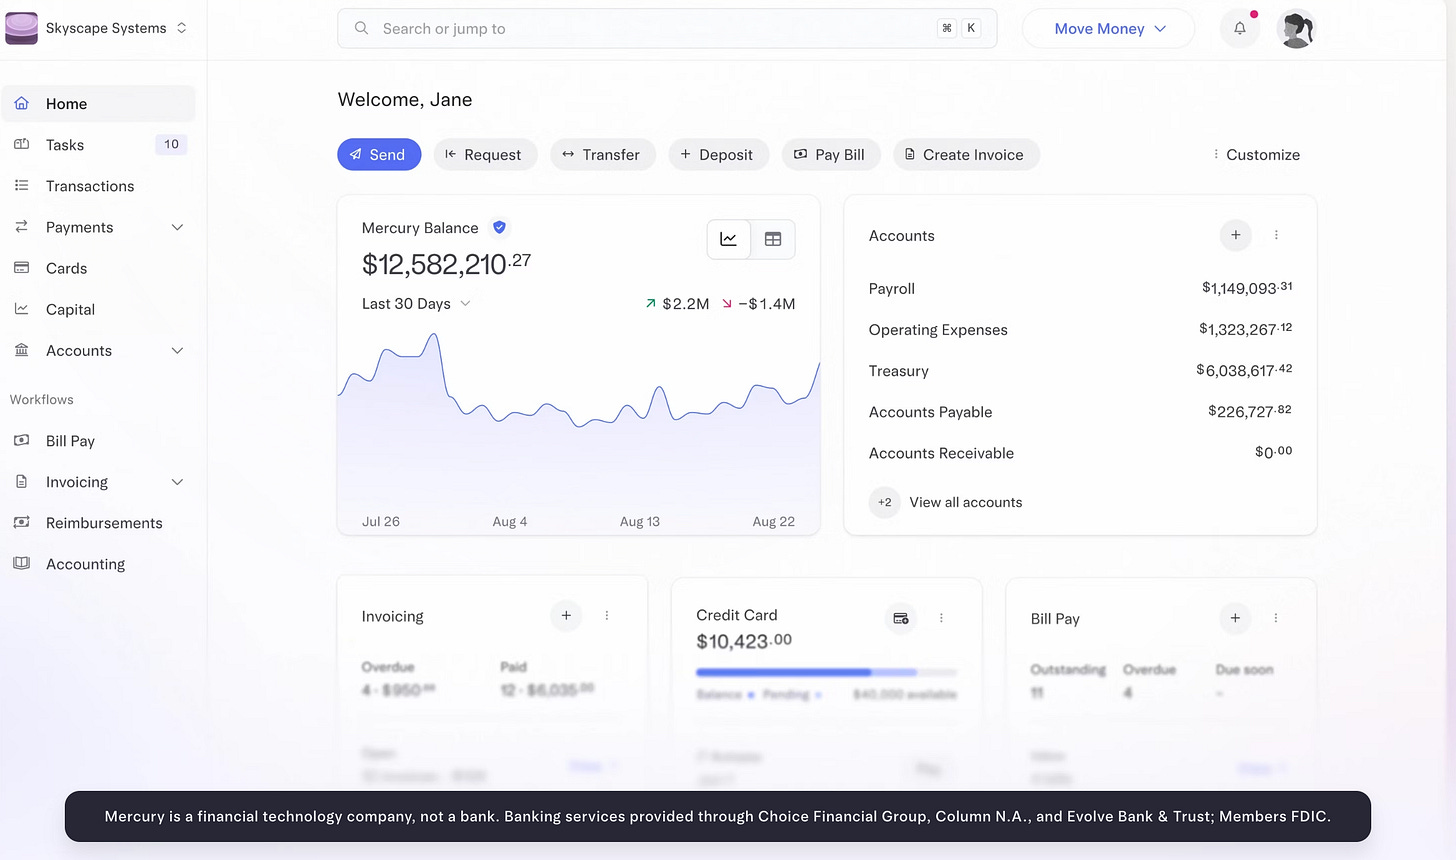
Mercury Bank’s website is very well designed, thus my choice to use them as a style guide for Lovable.
Within 1 prompt, we got a working product, in literally minutes. I was quite happy with result. Now I have an additional item for my portfolio.
Next Steps
Prototyping can happen with an image and a crisp instruction at one go.
This is the framework of the future.
Clearly though, we don’t know what we don’t know, so we have to experiment more.
Join Ari on Peerlist!
Join amazing folks like Ari and thousands of other builders on Peerlist.
0
15
0