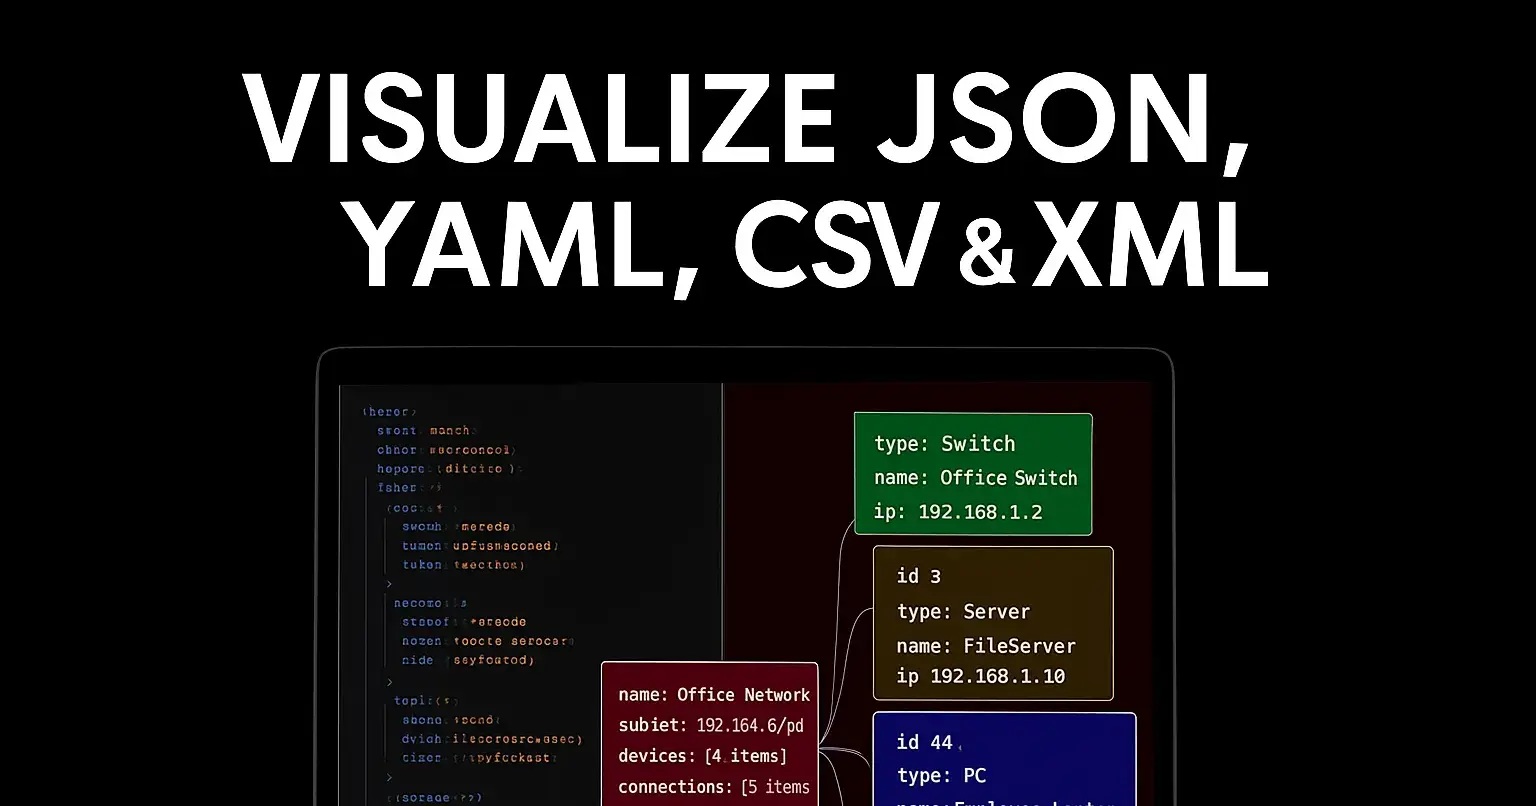
Visualize JSON, YAML, TOML and XML into diagrams in seconds
Turn structured data into clear, shareable diagrams — no manual drawing required.
Introduction
Structured data formats like JSON, YAML, TOML, and XML are everywhere: APIs, config files, build scripts, and data exports. They are compact and machine-friendly, but they can be hard to read and explain to teammates or stakeholders. That’s where visualization comes in.
This article shows how your JSON viewer transforms complex documents into interactive diagrams in seconds, so you can understand structure, spot problems, and share insights instantly.
Why visualize structured data?
Faster comprehension: Visual diagrams reveal structure, relationships, and nesting at a glance.
Better debugging: Identify unexpected arrays, missing keys, or duplicated fields quickly.
Stakeholder-friendly: Non-technical team members can understand data models without reading raw files.
Documentation: Visual schema diagrams make onboarding and docs clearer.
Supported formats
Your tool supports the main config/data formats used across projects:
JSON: Most API responses and many config files.
YAML: Used for configuration, CI/CD pipelines, and Kubernetes manifests.
TOML: Popular for lightweight config (e.g., Rust, Python poetry).
XML: Legacy systems, feeds, and some public APIs.
Each format is automatically parsed and normalized into a common internal model before visualization.
Key features
One-click visualize: Paste or upload a file and get a diagram instantly.
Interactive nodes: Click to expand/collapse nested objects and arrays.
Search & highlight: Find keys or values and highlight their locations in the diagram and raw text.
Export as PNG/SVG: Share diagrams in docs, presentations, or issue trackers.
Smart layout: Tree, radial, or compact graph layouts to fit different use cases.
Schema hints: Detect likely schema types (string, number, boolean, object, array) and show counts or example values.
Compare mode: Visually diff two documents to see structural changes.
How it works (under the hood)
Parsing: The input is parsed with format-specific parsers (JSON/YAML/TOML/XML) into an AST.
Normalization: ASTs are converted into a canonical node/edge graph representation.
Layout: A layout engine computes node positions using force-directed or tree algorithms based on the chosen view.
Rendering: The graph renders as SVG/Canvas with interactive controls for zoom, pan, and expand/collapse.
Export & share: Diagrams can be exported to image formats or embedded into documentation.
Quick start — Visualize in 3 steps
Paste or upload your JSON/YAML/TOML/XML file into the input panel.
Click
Visualize(or use the keyboard shortcutCtrl/Cmd+Enter).Explore the diagram — expand nodes, search keys, and export when ready.
Tip: Use the compact layout for large documents, and the tree layout for configuration files where order and hierarchy matter.
Use cases
API developers: Inspect payload structures and examples quickly.
DevOps & SRE: Visualize Kubernetes manifests and Helm values to spot misconfigurations.
Product managers: Review data contracts without diving into raw files.
Engineers migrating systems: Compare old and new schemas to ensure compatibility.
Best practices for clean diagrams
Remove sensitive fields (API keys, passwords) before sharing.
Use example values to make node labels more informative.
Collapse seldom-used branches to focus on the important parts.
Example workflow
Upload
config.yamlfor a microservice.Click Visualize → switch to Tree layout.
Search for
database.credentials— the path highlights in both the diagram and the source view.Export a PNG and attach it to the service onboarding doc.
Call to action
Start turning your configuration and API payloads into diagrams today — paste a file and visualize your first document in seconds. Share diagrams with your team and reduce the time it takes to understand, document, and debug structured data.
Try it now: https://jsonviewer.tools/
Join Animesh on Peerlist!
Join amazing folks like Animesh and thousands of other builders on Peerlist.
0
7
0