📉 BTC/USDT – Bearish TD Sequential Setup 9 Detected at $70.5K | 30M Chart
Interesting signal on Bitcoin's 30-minute chart today that's worth sharing with the builder and fintech community here.
📉 BTC/USDT – Bearish TD Sequential Setup 9 Detected at $70.5K | 30M Chart
Interesting signal on Bitcoin's 30-minute chart today that's worth sharing with the builder and fintech community here.
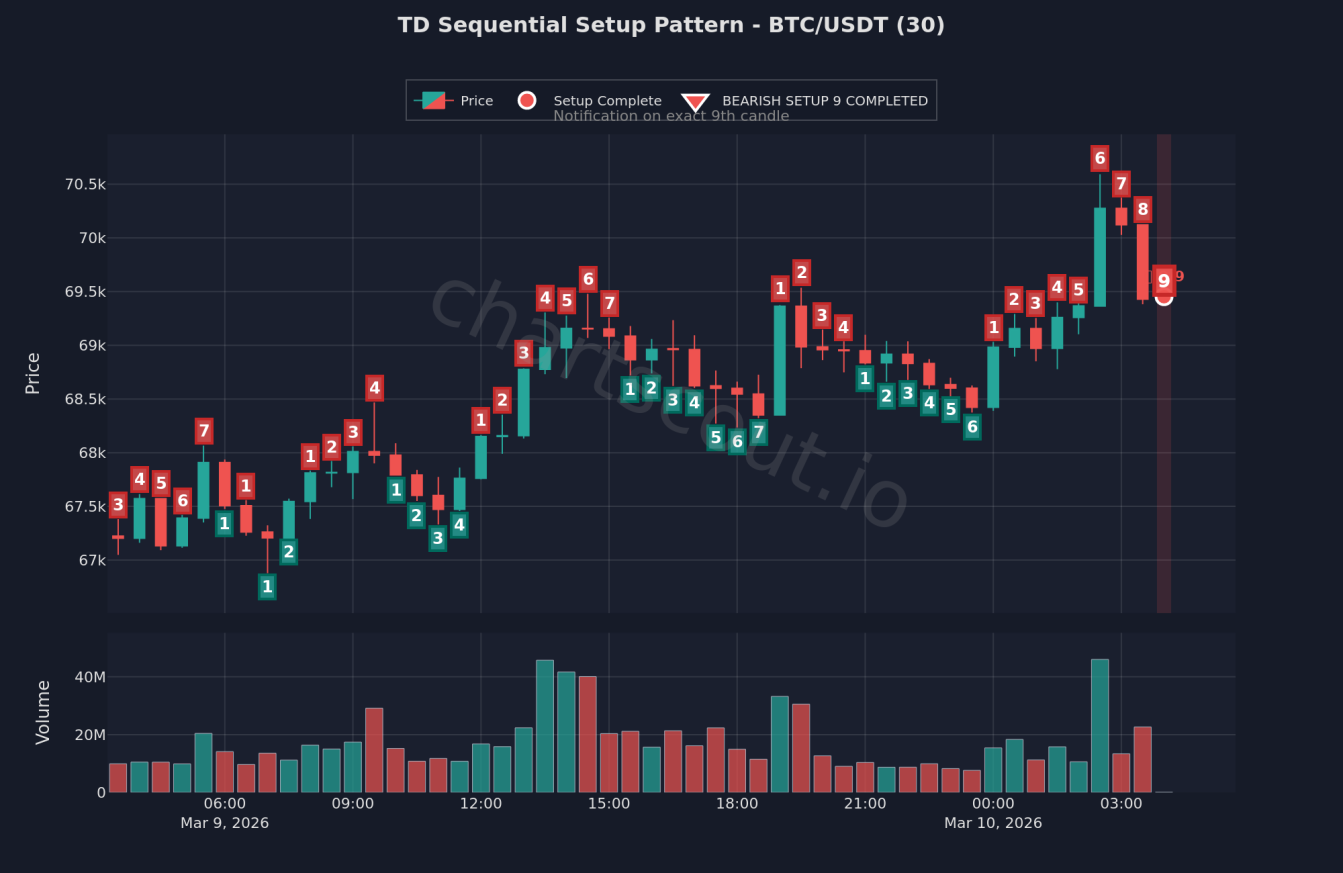
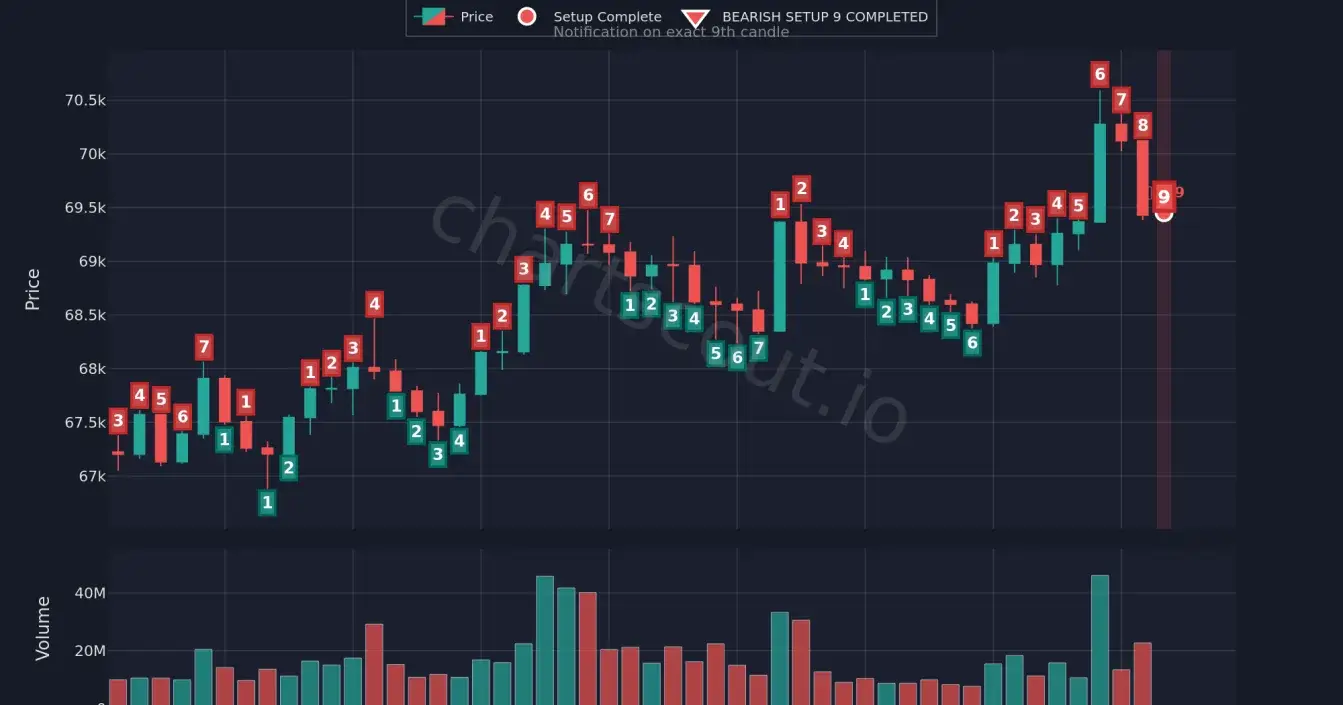
What the chart shows (Mar 9–10, 2026):
→ BTC ranged $67K–$69.5K across the entire March 9 session with active two-sided price action
→ At ~03:00 UTC March 10, a 40M+ volume candle the session's largest by a wide margin pushed price from ~$69K to $70.5K
→ Bearish TD Sequential Setup 9 printed immediately at that $70.5K local high
→ Classic "climax candle + exhaustion signal" confluence structure
From a systems perspective:
What makes this particularly interesting is that the Bearish 9 printed not after a slow grind, but immediately following the highest-volume candle of the two-session move. For those building pattern detection or backtesting systems, this raises a useful research question: Do TD Sequential signals that coincide with volume anomalies (>2x session average) carry higher predictive value than signals on normal volume?
In building ChartScout an automated crypto chart pattern detection tool this is exactly the kind of confluence filtering we've found meaningfully reduces false signals.
Would love to hear thoughts from the quant and fintech builders here on how you approach volume filtering in momentum exhaustion signals.
⚠️ Not financial advice. Shared for technical and research discussion.
Join Karan on Peerlist!
Join amazing folks like Karan and thousands of other builders on Peerlist.
0
5
0