📊 Reading Trend Exhaustion with TD Sequential - XPD/USDT (1H) Case Study
One of the more underrated tools in technical analysis is TD Sequential by Tom DeMark. Rather than following price momentum blindly, it quantifies when a trend may be running out of energy.
H
ere's how the Setup phase works:
→ Count 9 consecutive candles where each close is higher (bullish) or lower (bearish) than the close 4 bars prior
→ A completed count of 9 signals potential momentum exhaustion
→ It doesn't predict reversal — it identifies zones where a trend deserves closer attention
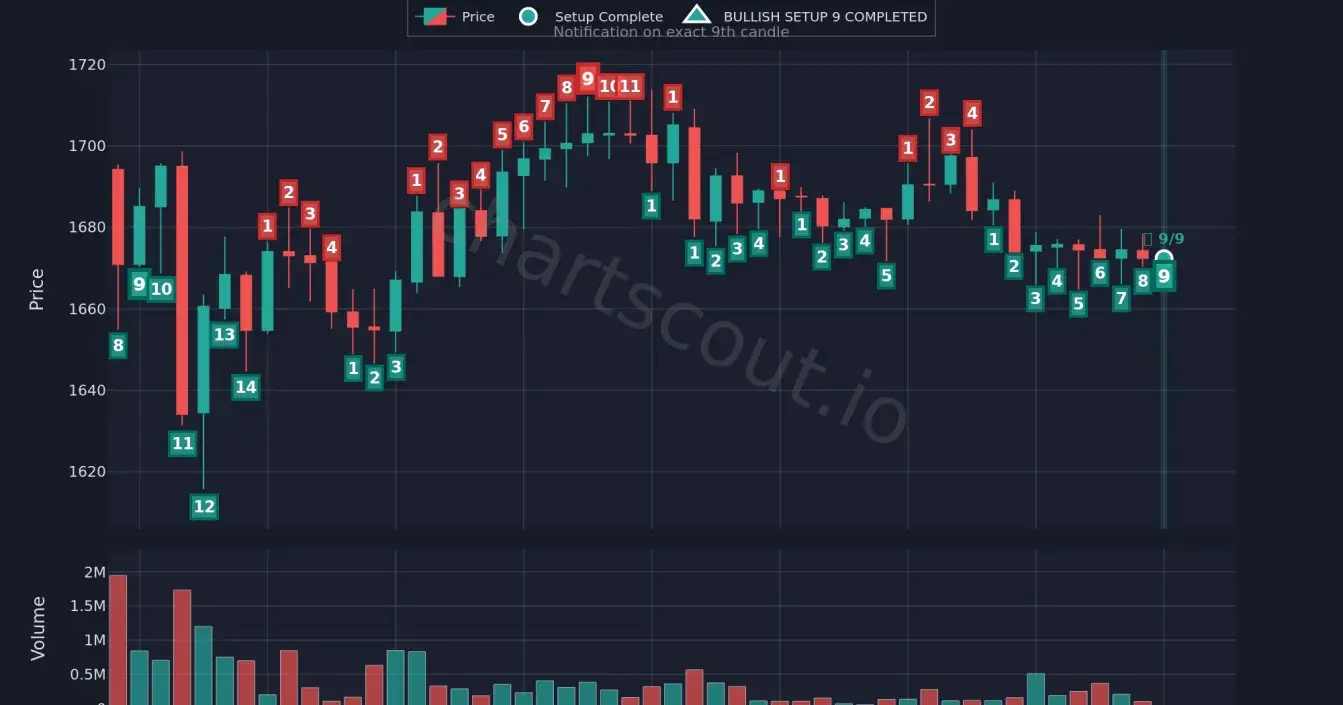
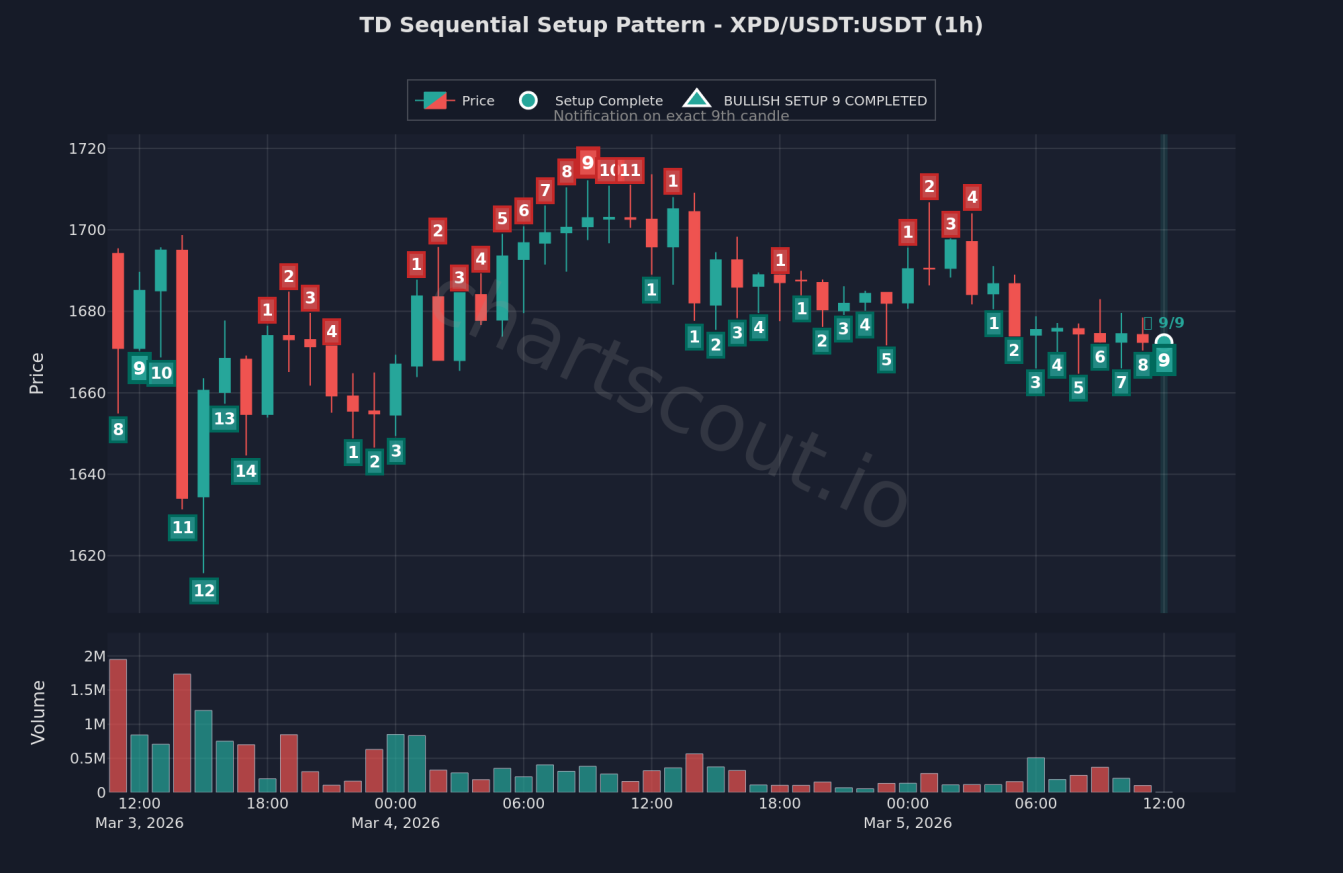
🔍 Real chart example — XPD/USDT 1H (Mar 3–5, 2026):
• Price moved from ~1,612 to a session high of ~1,718 over 48 hours
• Bullish Setup 9 completed near the local high around Mar 4, 06:00 UTC
• Price retraced following the signal, forming bearish sequences
• Volume declined steadily as price climbed a textbook exhaustion signature
• A fresh Bullish 9/9 setup is now forming again near ~1,665 on Mar 5
For developers and analysts building TA tools, TD Sequential is a great pattern to implement — the counting logic is straightforward, and the signal quality improves significantly when combined with volume analysis or support/resistance zones.
Chart by ChartScout.io
⚠️ Educational content only. Not financial advice.
#TechnicalAnalysis #TDSequential #CryptoTA #ChartPatterns #XPD #FinTech #ChartScout #CryptoEducation
Join Karan on Peerlist!
Join amazing folks like Karan and thousands of other builders on Peerlist.
0
2
0