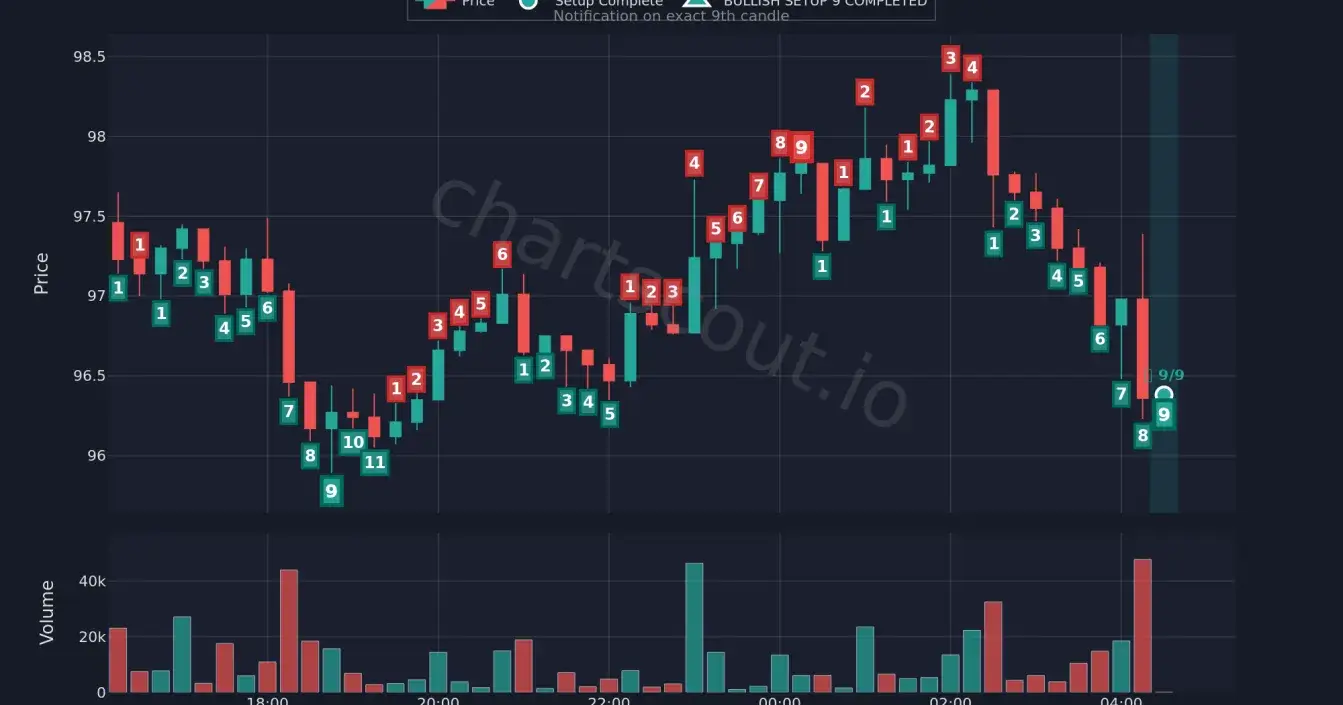
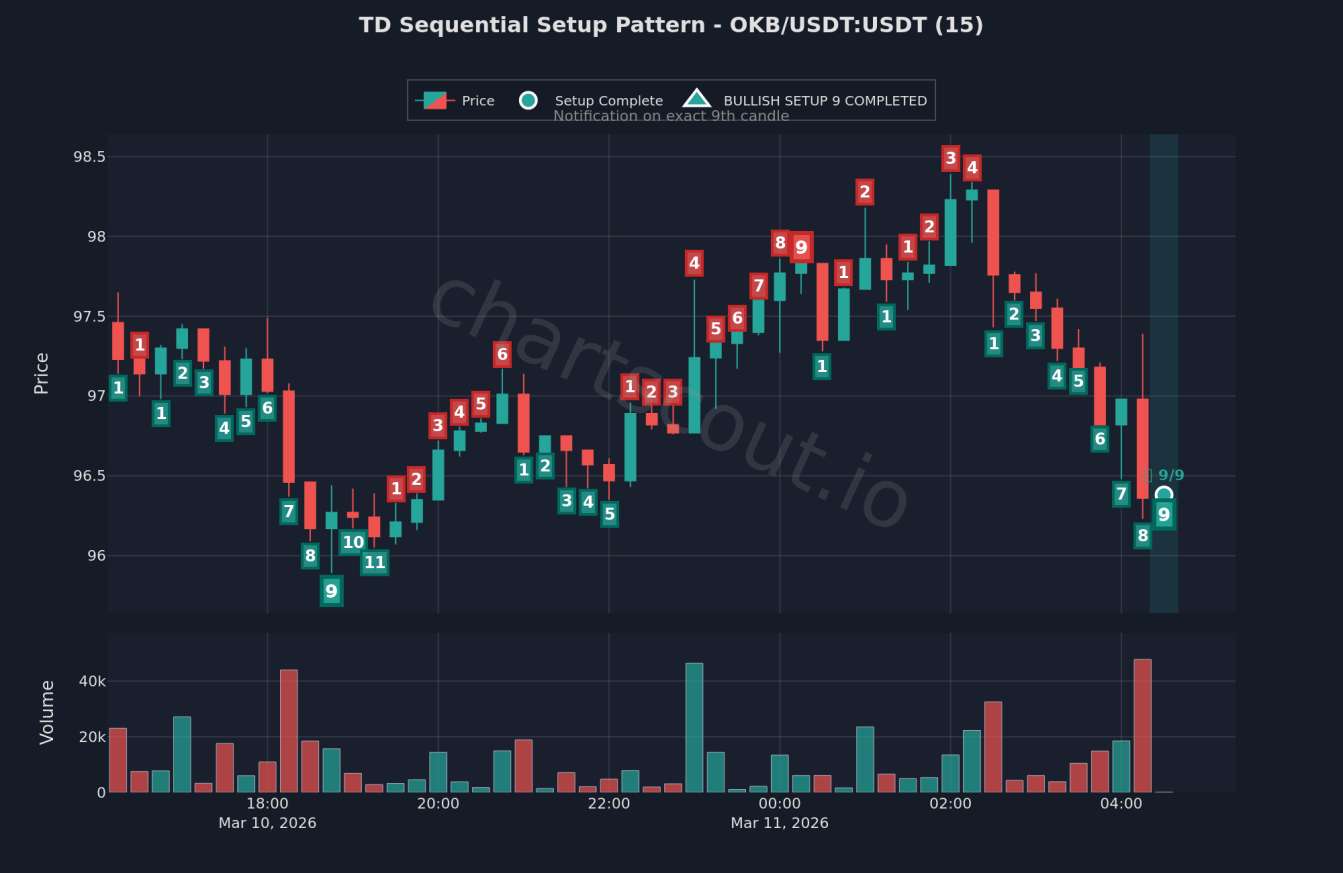
TD Sequential Setup Pattern - OKB/USDT (15m) | Mar 10–11, 2026
The TD Sequential is a fully rules-based momentum exhaustion indicator no subjectivity, no manual drawing. Just pure candle counting logic. Here's a live example on OKB/USDT's 15-minute chart.
How the logic works:
The indicator compares each candle's close to the close 4 bars earlier. If 9 consecutive candles each close lower than their reference bar that's a bullish setup (downtrend exhaustion). If 9 consecutive candles each close higher that's a bearish setup (uptrend exhaustion). The 9th candle triggers the signal.
What this chart shows (Mar 10–11, 2026):
→ OKB opened near 97.5 on Mar 10 and sold off to ~96 through the evening
→ Bearish setups (red 1–9) formed during the decline with an extended count reaching 11 at the lows unusually deep exhaustion in the selloff
→ Price reversed and rallied strongly to ~98.5 by early Mar 11
→ Multiple bearish setups flagged exhaustion across each rally phase near 98–98.5
→ Bullish Setup 9/9 just completed near 96.5 current pullback may be losing momentum
Why the 11-count is worth noting:
A standard TD Sequential setup completes at 9. When the count extends to 10 or 11, it means the trend was strong enough to push past the normal exhaustion point but eventually momentum always runs out. The subsequent recovery from those lows validates the signal in hindsight.
This kind of pattern detection is fully automated at ChartScout.io built to scan crypto markets and surface these setups in real time across hundreds of pairs.
For builders and analysts interested in the technical side: the detection logic is straightforward to implement and works across any timeframe and any asset class.
⚠️ Educational purposes only. Not financial advice.
Join Karan on Peerlist!
Join amazing folks like Karan and thousands of other builders on Peerlist.
0
3
0