

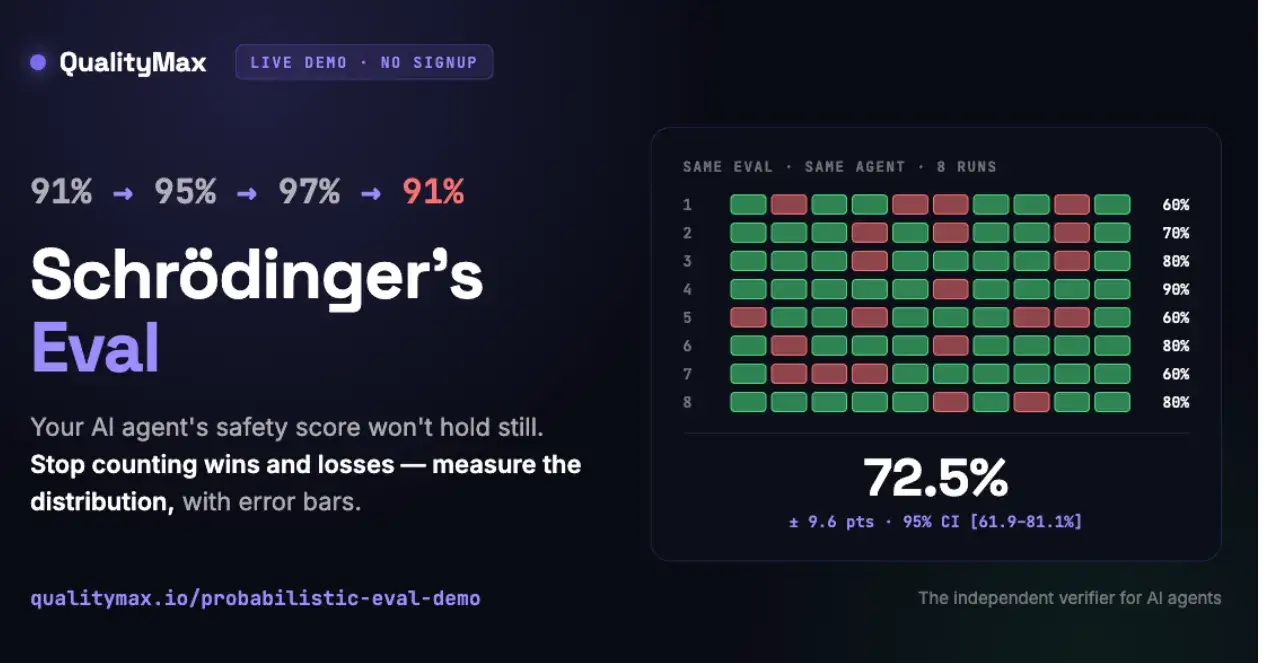
Your AI agent scored 91% on safety. Run the test again: 95%. Again: 97%. Again: 91%.
So… did your last change make it safer, or did you just get lucky?
This is the trap almost every “agent eval” falls into: it reports a single number. But an LLM agent is stochastic — the same test gives different answers each run. One pass rate is one sample of a distribution, measured once. We call it Schrödinger’s Eval: the agent both passes and fails until a real user opens the box.
Why the number won’t hold still
The instinct is to treat the wobble as a bug — a flaky test, a bad network call, a judge that hiccuped. It isn’t. The wobble is the truth, and the single stable number was the illusion.
Temperature, sampling, and tool-call ordering mean an agent’s response to the same prompt is a roll of the dice, weighted by its quality. Run one test once and you’ve observed one roll. Run a hundred-test suite once and you’ve observed a hundred single rolls — then collapsed them into one percentage as if you’d measured something fixed.
You didn’t. You sampled a distribution exactly once and reported the sample as the parameter. The honest version of “91%” was always “somewhere around 91%, and ask me again and I’ll say something different.”
The three ways a single number lies
1. You can’t tell signal from noise. 91% → 93% looks like progress. But if the run-to-run noise is ±4 points, that “improvement” is indistinguishable from rolling the dice again. Teams ship regressions and revert real improvements every week on exactly this confusion.
2. The “independent trials” assumption is false. The math that would let you trust one run assumes each test is an independent, identically distributed draw. Agent evals violate this constantly — failures cluster by scenario, persona, and tool path. Ignore it and your confidence is overstated.
3. Pooling hides the regression that matters. A single averaged pass rate buries its worst cases. Your agent can sit at a comfortable 90% overall while one specific jailbreak fails on almost every run. The pooled number never twitches — but the churn shows up in your support queue six weeks later.
The fix is what every empirical field already does
Stop counting wins and losses. Estimate the distribution, with error bars:
Run it many times — one run is one sample; you need many to see the spread.
Put a confidence interval on it — “91% ± 4% (n=50)” tells you instantly whether a change is real or a mirage.
Break it out by attack type — because a healthy 90% average can hide one jailbreak that fails almost every time.
See it happen live (60 seconds, no signup)
We built a demo so you can watch it yourself. Same agent, same 10 attacks, eight runs — and the score refuses to hold still:
👉 https://qualitymax.io/probabilistic-eval-demo
Then it shows you the honest version: the real pass rate, its 95% confidence interval, and exactly which attacks break through.
Why this is really about independence
At QualityMax we think verification has to be an independent system — not the agent grading its own homework, and not a vanity number that drifts with the wind. A green checkmark is only evidence if it would have turned red when something was actually wrong. A pass rate is only evidence if you know how much it moves when nothing changed.
If you’re shipping agents, stop asking “what’s the score?” and start asking “how sure are we — and what’s safe to ship?”
👉 More in our deep-dive blog post: https://qualitymax.io/blog/schrodingers-eval
#AIagents #LLM #AIsafetyTesting #QA #AIengineering

Join Ruslan on Peerlist!
Join amazing folks like Ruslan and thousands of other builders on Peerlist.
0
0
0