

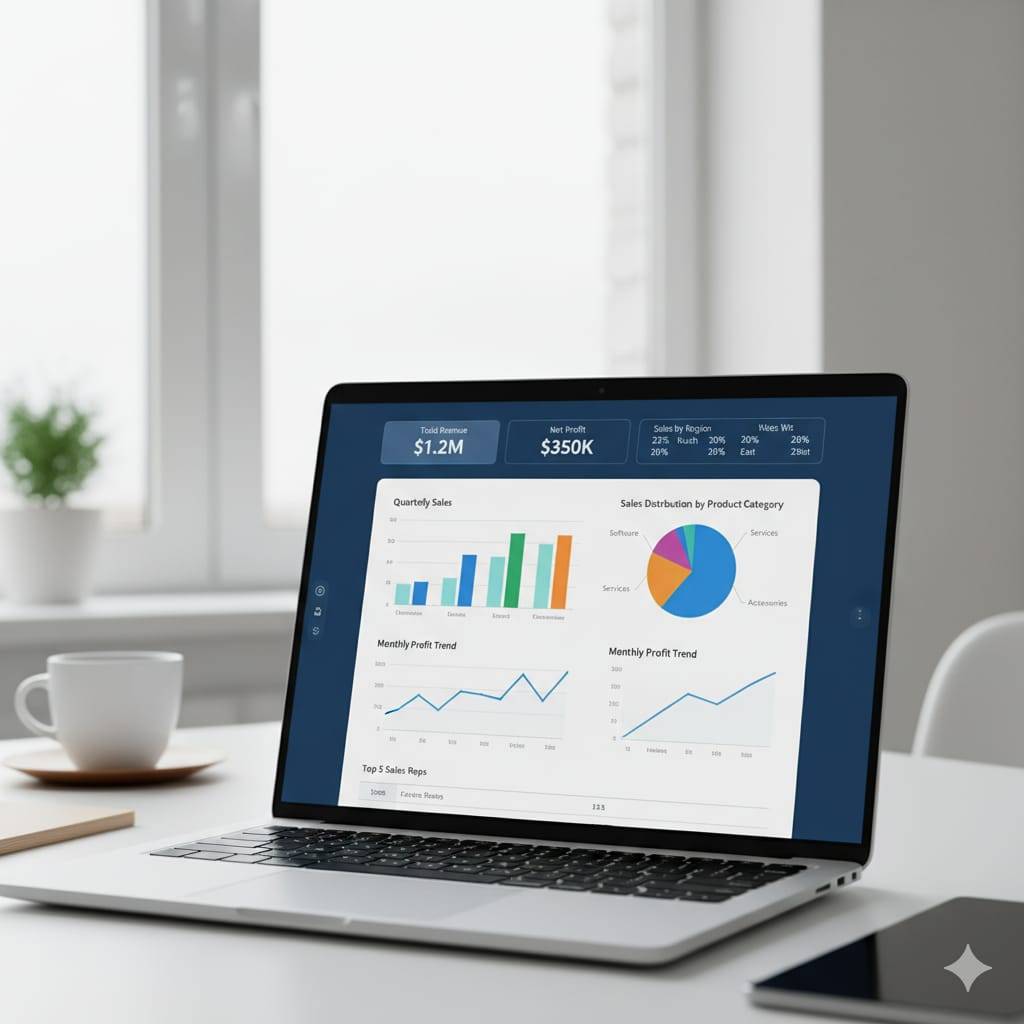
Sales Performance Analysis Dashboard
Sales Performance Analysis Dashboard
Built an interactive Retail Superstore Sales dashboard using a synthetic 1,000‑order dataset to analyze performance across time, products, customers, regions, and shipping modes. The dashboard highlights key KPIs (Sales, Profit, Profit Margin), trends by month and year, and drilldowns into categories/sub‑categories and top products. Geographic views reveal regional opportunities, while customer segmentation and Pareto analysis surface high‑value cohorts for targeted retention and upsell. Operational insights include average shipping time by ship mode and its relationship to repeat purchase behavior, informing logistics optimization. The project showcases end‑to‑end skills in data prep, modeling, and dashboard design for decision‑ready insights.
Built with