🚀 Logistic Regression: A Complete Guide with Theory, Math, and Practical Insights
Logistic Regression is one of the most popular algorithms for binary classification problems. Whether you’re predicting whether a transaction is fraudulent or an email is spam, Logistic Regression often serves as the first go-to model.
In this article, we’ll go from theory to implementation, covering the math, cost functions, evaluation metrics, and practical tips for dealing with real-world challenges like unbalanced datasets.
1️⃣ What is Logistic Regression?
Logistic Regression is a supervised machine learning algorithm used for classification problems. Unlike linear regression which predicts continuous values it predicts the probability that an input belongs to a specific class. It is used for binary classification where the output can be one of two possible categories such as Yes/No, True/False or 0/1. It uses sigmoid function to convert inputs into a probability value between 0 and 1. In this article, we will see the basics of logistic regression and its core concepts.
Example:
Predict if a student will pass (1) or fail (0) an exam based on study hours.
Input (
X): Study hoursOutput (
y): Pass/Fail (binary outcome)
2️⃣ Mathematical Intuition Behind Logistic Regression
Linear regression predicts values directly (like 2.5, 10.7), which doesn’t work for probabilities because they must be between 0 and 1.
To solve this, Logistic Regression uses the sigmoid function:
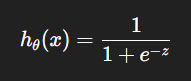
Where:
z=mx + c (linear combination of inputs)
Output is squashed between 0 and 1.
3️⃣ Cost Function of Logistic Regression
We can’t use the Mean Squared Error (MSE) like in Linear Regression because it leads to a non-convex function, making optimization harder.
Instead, Logistic Regression uses the Log Loss (Binary Cross-Entropy):
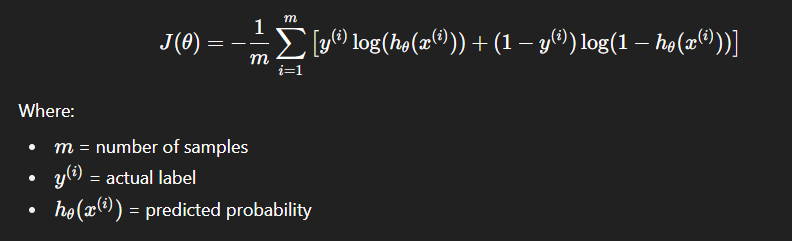
if you want how this calculate watch this video
5️⃣ Assumptions of Logistic Regression
Understanding the assumptions behind logistic regression is important to ensure the model is applied correctly, main assumptions are:
Independent observations: Each data point is assumed to be independent of the others means there should be no correlation or dependence between the input samples.
Binary dependent variables: It takes the assumption that the dependent variable must be binary, means it can take only two values.
Linearity relationship between independent variables and log odds: The model assumes a linear relationship between the independent variables and the log odds of the dependent variable which means the predictors affect the log odds in a linear way.
No outliers: The dataset should not contain extreme outliers as they can distort the estimation of the logistic regression coefficients.
Large sample size: It requires a sufficiently large sample size to produce reliable and stable results.
7️⃣ How Does Logistic Regression Work?
Take input features and calculate linear combination:

Apply the sigmoid function to get probabilities.
Classify based on a threshold (default = 0.5).

9️⃣ Terminologies Involved
Here are some common terms involved in logistic regression:
Independent Variables: These are the input features or predictor variables used to make predictions about the dependent variable.
Dependent Variable: This is the target variable that we aim to predict. In logistic regression, the dependent variable is categorical.
Logistic Function: This function transforms the independent variables into a probability between 0 and 1 which represents the likelihood that the dependent variable is either 0 or 1.
Odds: This is the ratio of the probability of an event happening to the probability of it not happening. It differs from probability because probability is the ratio of occurrences to total possibilities.
Log-Odds (Logit): The natural logarithm of the odds. In logistic regression, the log-odds are modeled as a linear combination of the independent variables and the intercept.
Coefficient: These are the parameters estimated by the logistic regression model which shows how strongly the independent variables affect the dependent variable.
Intercept: The constant term in the logistic regression model which represents the log-odds when all independent variables are equal to zero.
Maximum Likelihood Estimation (MLE): This method is used to estimate the coefficients of the logistic regression model by maximizing the likelihood of observing the given data.
🔟 Implementation Example (Python)
from sklearn.linear_model import LogisticRegression
from sklearn.model_selection import train_test_split
from sklearn.metrics import classification_report, confusion_matrix
import pandas as pd

# Example: Titanic dataset
data = pd.read_csv("titanic.csv")
X = data[['Age', 'Fare']]
y = data['Survived']

X_train, X_test, y_train, y_test = train_test_split(X, y, test_size=0.2, random_state=42)

model = LogisticRegression()
model.fit(X_train, y_train)
y_pred = model.predict(X_test)

print(confusion_matrix(y_test, y_pred))
print(classification_report(y_test, y_pred))
Evaluating Logistic Regression Models
Confusion Matrix:
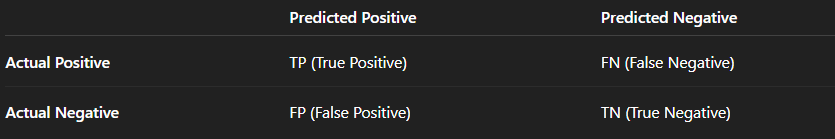
Metrics:
Accuracy = (TP+TN)/(Total)
Recall (Sensitivity) = TP/(TP+FN)
Specificity = TN/(TN+FP)
Precision = TP/(TP+FP)
F1-score = Harmonic mean of Precision & Recall.
Handling Unbalanced Datasets
Unbalanced datasets occur when one class is much more frequent than the other.
Example: Fraud detection (99% non-fraud, 1% fraud).
Solutions:
Resampling (Oversampling minority, undersampling majority)
Class weights (Give higher weight to minority class)
Synthetic Data Generation (SMOTE)
Evaluation Tip: Use Precision, Recall, F1-score, and ROC-AUC, not just Accuracy.
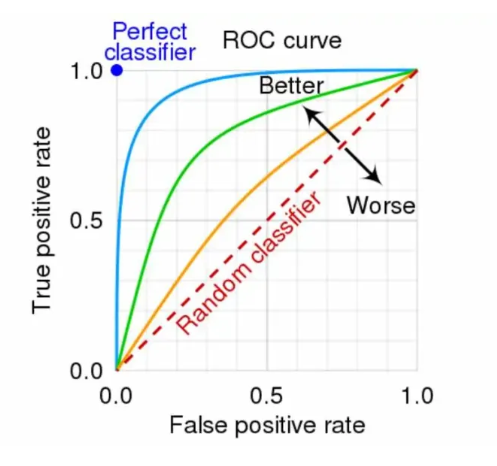
1️⃣3️⃣ ROC-AUC Curve Explained
ROC (Receiver Operating Characteristic) plots:
X-axis: False Positive Rate (FPR)
Y-axis: True Positive Rate (TPR)
AUC (Area Under Curve):
1.0 → Perfect classifier
0.5 → Random guess
True Positive Rate (TPR) / Sensitivity / Recall
Measures how many actual positives you correctly predicted as positive.
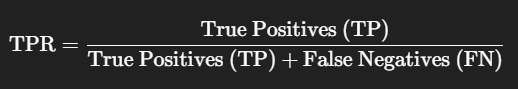
TP → Positive cases correctly predicted as positive
FN → Positive cases incorrectly predicted as negative
Example:
If 100 people actually have a disease, and your model predicts 90 of them as positive, then:

False Positive Rate (FPR)
Measures how many actual negatives you incorrectly predicted as positive.
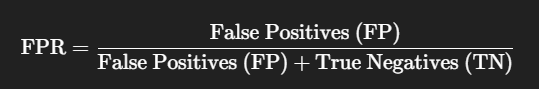
FP → Negative cases incorrectly predicted as positive
TN → Negative cases correctly predicted as negative
Example:
If 200 people don’t have the disease, but your model predicts 50 of them as positive:

How It Fits into ROC Curve
X-axis = FPR → The "cost" of predicting more positives (including false ones).
Y-axis = TPR → The "benefit" of predicting positives correctly.
Each point on the ROC curve represents a different classification threshold.
When you lower the threshold,
TPR increases (more positives caught)
FPR also increases (more false positives).
💡 Visual interpretation:
Draw an X-axis (FPR: 0 → 1)
Draw a Y-axis (TPR: 0 → 1)
Plot curve starting near (0,0) going toward (1,1).
Closer the curve to top-left corner (0,1) → Better model.
Impact of Changing the Threshold
Decrease threshold (e.g., 0.5 → 0.2):
More predictions classified as positive
Recall ↑ (more true positives found)
Precision ↓ (more false positives)
Real-world example:
In medical diagnosis, lowering the threshold means catching more sick patients (higher recall) but also increasing false alarms (lower precision).
📌 Important ML Interview Questions on Logistic Regression
Conceptual & Theory
What is Logistic Regression, and how is it different from Linear Regression?
Why do we use the Sigmoid function in Logistic Regression?
What are the assumptions of Logistic Regression?
Explain the concept of log-odds in Logistic Regression.
Why can’t we use Mean Squared Error as a cost function for Logistic Regression?
What is the intuition behind the cost function in Logistic Regression?
How do you interpret the coefficients of a Logistic Regression model?
What is the decision boundary in Logistic Regression?
Mathematical & Technical
Derive the formula for the Sigmoid function.
Explain the concept of Maximum Likelihood Estimation (MLE) in Logistic Regression.
Write the formula for True Positive Rate (TPR) and False Positive Rate (FPR) used in ROC curves.
How does Gradient Descent work in Logistic Regression?
Explain the difference between L1 and L2 regularization in Logistic Regression.
Evaluation & Practical
How do you evaluate a Logistic Regression model?
Explain Precision, Recall, F1-score, and when to use them.
What is the ROC-AUC curve, and how do you interpret it?
How does changing the classification threshold affect Precision and Recall?
How do you handle imbalanced datasets in Logistic Regression?
When would you prefer Recall over Precision in a real-world application?
Give an example where Logistic Regression might fail and why.
✅ Final Thoughts:
Logistic Regression is simple yet powerful. Understanding not just the implementation, but also the underlying math and evaluation metrics, ensures you can apply it effectively to real-world classification problems.
Join Jugal on Peerlist!
Join amazing folks like Jugal and thousands of other builders on Peerlist.
0
3
0