📊 Types of Tests in Inferential Statistics
Understand the foundation of decision-making using data Author: Jugal Kishore Date: August 3, 2025
🧠 Introduction
Inferential statistics allows us to make predictions or inferences about a population based on a sample. A critical component of inferential statistics is hypothesis testing, where we apply statistical tests to draw conclusions.
There are different types of tests based on:
The type of data (numerical or categorical)
The number of samples
Whether we're comparing means, proportions, or variances
Let’s dive deep into each type of test with real-world examples. 📚
1. 🧪 Z-Test
🔍 Used When:
The sample size is large (n > 30)
Population standard deviation (σ) is known
📌 Types:
One-Sample Z-Test
Two-Sample Z-Test
📈 Example:
Suppose the average score of students in a national exam is 70 (σ = 10). You take a sample of 50 students from your college, and their average score is 74. Can we say your college performed better?
Here, a one-sample Z-test helps compare the sample mean to the population mean.
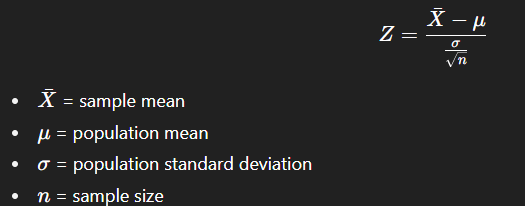
🔹 1. One-Sample Z-Test
✅ Purpose:
To test whether the sample mean is significantly different from the population mean when population standard deviation (σ) is known.
📌 Formula:
📈 Example:
Population mean IQ = 100 (σ = 15)
Sample of 49 students has a mean IQ of 104.
Is this significantly different?
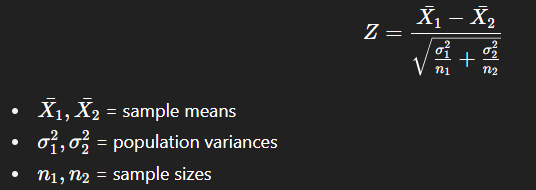
🔹 2. Two-Sample Z-Test
✅ Purpose:
To compare the means of two independent large samples from populations with known variances.
📌 Formula:
📈 Example:
Compare the average marks of two schools (each with >30 students) where σ is known.
2. 📉 T-Test
🔍 Used When:
The sample size is small (n < 30)
Population standard deviation is unknown
📌 Types:
One-Sample T-Test
Paired Sample T-Test
📈 Example:
You want to compare the average salaries of male and female developers in your company. You collect data from 25 males and 25 females.
Use an independent two-sample T-test to see if there is a statistically significant difference.
🔹 1. One-Sample T-Test
✅ Purpose:
To test whether the sample mean is significantly different from a known value (usually population mean), but σ is unknown.
📌 Formula:
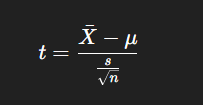
s = sample standard deviation
📈 Example:
A machine produces rods. Expected length = 10 cm. A sample of 15 rods gives a mean = 10.3 cm, s = 0.2. Is this significant?
🔹 2. Paired Sample T-Test
✅ Purpose:
To compare the means of two related samples (before vs after treatment).
📌 Formula:
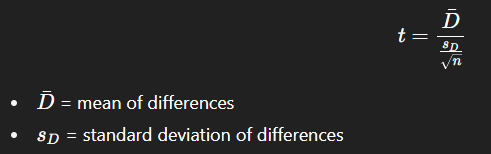
📈 Example:
Test the effect of a training program on employees' performance.
3. 🧮 Chi-Square Test (χ² Test)
🔍 Used For:
Categorical data
Testing relationships between two variables
📌 Types:
Chi-Square Test for Independence
Chi-Square Goodness of Fit Test
📈 Example:
You want to test if gender and preferred programming language are related.
Create a contingency table and use the Chi-Square Test of Independence.
If p-value < 0.05 → Variables are dependent (i.e., there's a relationship).
🔹 1. Chi-Square Test for Independence
✅ Purpose:
To test whether two categorical variables are independent or associated.
📌 Formula:
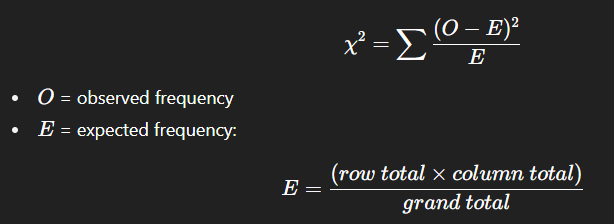
📈 Example:
Check whether gender and product preference are related.
🔹 2. Chi-Square Goodness of Fit Test
✅ Purpose:
To see if a sample fits a particular distribution.
📌 Formula:
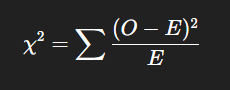
📈 Example:
Check if the number of users visiting a website on each day follows a uniform distribution.
4. 🧭 ANOVA (Analysis of Variance)
🔍 Used When:
Comparing means of 3 or more groups
📌 Types:
One-Way ANOVA (single factor)
Two-Way ANOVA (two factors)
📈 Example:
You want to test if average exam scores differ among three different teaching methods.
Use One-Way ANOVA to compare the means of the three groups.
If p-value < 0.05 → At least one group mean is significantly different.
🔹 1. One-Way ANOVA (Single Factor)
✅ Purpose:
To test if three or more group means are equal using a single independent variable.
📌 Formula:
📈 Example:
Compare test scores of students taught by 3 different teachers.
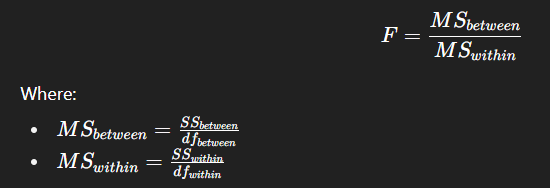
🔹 2. Two-Way ANOVA (Two Factors)
✅ Purpose:
To test the effect of two independent variables on a dependent variable, and their interaction.
📌 Components:
Main effect of factor A
Main effect of factor B
Interaction effect (A × B)
Each has its own F-statistic:
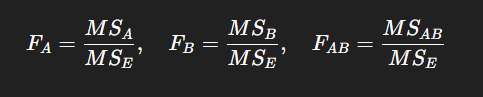
📈 Example:
Study effect of diet type and exercise routine on weight loss.
🧠 Final Thoughts
Choosing the right statistical test is crucial for making valid inferences. Each test has assumptions and use-cases, and misapplying them can lead to false conclusions.
📌 Pro Tip:
Always check for normality, variance equality, and sample size before choosing a test.
💡 Example Use Case: Real-World Decision
Let’s say you run an EdTech company. You want to know:
If your new teaching model improves test scores → Paired T-Test
If your app is equally preferred by all age groups → Chi-Square Test
If different marketing campaigns affect conversion rates → ANOVA
By understanding these tests, you can make data-driven decisions with confidence.
Join Jugal on Peerlist!
Join amazing folks like Jugal and thousands of other builders on Peerlist.
1
16
0