📊 Understanding Central Limit Theorem (CLT) with Real-Life Example
The Central Limit Theorem (CLT) is one of the most powerful and foundational concepts in statistics and data science. Whether you're analyzing data for insights, building machine learning models, or t
🧠 What is the Central Limit Theorem?
The Central Limit Theorem states:
“Given a sufficiently large sample size from a population with a finite level of variance, the sampling distribution of the sample mean will approximate a normal distribution — regardless of the shape of the population distribution.”
In simpler terms:
Take any population (can be skewed, uniform, or weird-shaped).
Take many samples of the same size from that population.
Calculate the mean of each sample.
Plot these means in a histogram.
The resulting plot will look normal (bell-shaped)!
🧪 Why is CLT Important?
It makes inference possible: Thanks to CLT, we can make predictions or confidence intervals about population parameters even if the data isn’t normally distributed.
Foundation for Hypothesis Testing: Most statistical tests assume normality CLT helps us reach that assumption by working with sample means.
Useful in Real-World Scenarios: Whether you're A/B testing a website, analyzing customer behavior, or checking the average time spent on an app CLT is quietly working behind the scenes.
📌 Real-Life Example: Bakery Case Study
🎯 Problem:
Imagine you're a bakery owner. Your cookies vary slightly in weight. The population distribution of cookie weights is right-skewed (because some cookies are heavier than usual due to extra toppings).
You want to know the average weight of a cookie but can't weigh all cookies in the world — so you take samples.
📊 Step-by-Step:
You take 50 samples of 30 cookies each.
For each sample, you calculate the mean weight of the 30 cookies.
You now have 50 mean values. You plot these means.
Surprise! Even though the original population (cookie weights) was skewed, the distribution of sample means looks normal!
This is the Central Limit Theorem in action.
🧮 CLT in Mathematical Terms
Let’s denote:
X1,X2,...,Xn: i.i.d. random variables with mean μ and variance σ2.
Then, as n→∞:
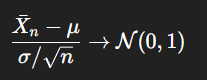
This means the standardized sample mean converges in distribution to a standard normal distribution.
🔍 When Does CLT Work?
Sample Size: Generally, a sample size n≥30 is considered large enough.
Independence: Samples should be independent.
Finite Variance: The population should have a finite variance.
⚠️ Common Misconceptions
CLT doesn't say the data becomes normal — it says the distribution of the sample mean becomes normal.
It doesn't require the population to be normal — that’s the beauty of it!
Larger samples → better approximation: The bigger your sample size, the more the distribution of the sample mean looks like a bell curve.
💡 Applications of CLT
Machine Learning: Estimating model error using cross-validation
Finance: Modeling average returns of assets
Healthcare: Clinical trial results often rely on sample means
A/B Testing: Assessing differences between groups (e.g., website clicks)
🧠 Final Thoughts
The Central Limit Theorem is a quiet hero in the world of statistics. It empowers us to trust sample data, make predictions, and derive insights — even when the population data is messy, skewed, or non-normal.
So next time you're running an experiment or analyzing sample data, remember — thanks to CLT, you don’t need perfection to make smart decisions.
Join Jugal on Peerlist!
Join amazing folks like Jugal and thousands of other builders on Peerlist.
0
1
0