📊 Understanding Kurtosis in Statistics: A Beginner-Friendly Guide
In the world of data analysis and statistics, we often hear terms like mean, variance, standard deviation, and skewness. But there's another important measure that tells us a lot about how data behaves — it's called Kurtosis.
In this article, we’ll understand:
What is Kurtosis?
Why is it important?
Different types of Kurtosis
Real-world examples
How to calculate it
✅ What is Kurtosis?
Kurtosis is a statistical measure that tells us how peaked or flat the distribution of data is — especially focusing on the tails of the distribution.
In simple words:
Kurtosis helps us understand how heavy or light the tails of a data distribution are compared to a normal distribution.
📌 Think of a Bell Curve
Imagine a normal bell curve (used in many statistical models). Some distributions are more peaked (sharper in the center) or have heavier tails, while others are flatter or have lighter tails. This difference is measured by kurtosis.
📚 Types of Kurtosis
There are three main types of kurtosis:
1️⃣ Mesokurtic (Normal Kurtosis)
The standard normal distribution has a kurtosis of 3.
This is called mesokurtic.
It represents a moderate peak and moderate tails.
🟢 Example: Tossing a fair coin many times and recording outcomes.
2️⃣ Leptokurtic (High Kurtosis)
Kurtosis > 3
Sharp peak with heavy tails
Data is concentrated near the mean but has more outliers.
🔥 Real-world example:
Stock market returns — most days show average returns, but some rare days have huge profits or losses (outliers).
3️⃣ Platykurtic (Low Kurtosis)
Kurtosis < 3
Flat peak with light tails
Data is more evenly spread out, with fewer outliers.
🌰 Real-world example:
Student attendance — most students attend regularly, and very few extreme variations.
🧮 How is Kurtosis Calculated?
You can calculate kurtosis using the formula:
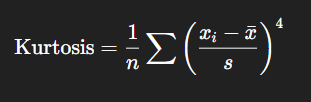
Where:
xix_ixi = each data point
xˉ\bar{x}xˉ = mean of the data
sss = standard deviation
nnn = number of data points
📌 The 4th power in the formula makes kurtosis more sensitive to extreme values (outliers).
🧠 Important Note:
Many software/tools like Python, Excel, or R return “excess kurtosis”, which is:
Excess Kurtosis=Kurtosis−3\text{Excess Kurtosis} = \text{Kurtosis} - 3Excess Kurtosis=Kurtosis−3
So:
Normal (mesokurtic) → 0
Leptokurtic → > 0
Platykurtic → < 0
🔚 Conclusion
Kurtosis is a powerful tool in statistics that helps you understand the behavior of data, especially when it comes to outliers and distribution shapes. Whether you are analyzing financial trends, health data, or quality control metrics, kurtosis can give you insights beyond just mean and standard deviation.
💡 Always remember:
Kurtosis tells you how "normal" or "extreme" your data is — especially in the tails.
🛠️ Bonus: Python Code to Calculate Kurtosis
import scipy.stats as stats

data = [10, 12, 13, 15, 18, 22, 100]  # sample data with an outlier

kurtosis = stats.kurtosis(data)  # returns excess kurtosis
print(f"Kurtosis (excess): {kurtosis}")
Join Jugal on Peerlist!
Join amazing folks like Jugal and thousands of other builders on Peerlist.
0
6
0