See the Complete Picture: Visualize How Research Ideas Flow Through Time
You found the perfect paper. It has 47 references and 156 citations. Now what?

Most tools give you a list. A long, overwhelming list of titles sorted by date or relevance score. You scroll, you click, you open tabs, you lose track. An hour later, you’re drowning in browser tabs with no clear sense of how these papers actually connect.
Which references were foundational to the field? Which citing papers took the ideas in new directions? How did this research spread across disciplines? Lists can’t answer these questions.
Research is a Conversation Across Time
Every paper exists within a web of intellectual dialogue. It builds on what came before and shapes what comes after. Understanding this context transforms how you engage with research.
When you can see that a 2015 machine learning paper cites foundational statistics work from the 1990s alongside recent computer vision papers, you understand something important about how the field evolved. When you notice that a finance paper is being cited by researchers in public health and education, you’re seeing ideas cross disciplinary boundaries in real time.
This context matters. It helps you identify seminal works, spot emerging trends, and understand where your own research fits in the larger conversation.
Mapping the Flow of Ideas
Base’s citation network visualization transforms abstract citation data into a spatial map of research influence. Paper citation network overview showing focus paper in center, references on left (blue lines), citing papers on right (orange lines), organized by topic rows with year headers
Press enter or click to view image in full size
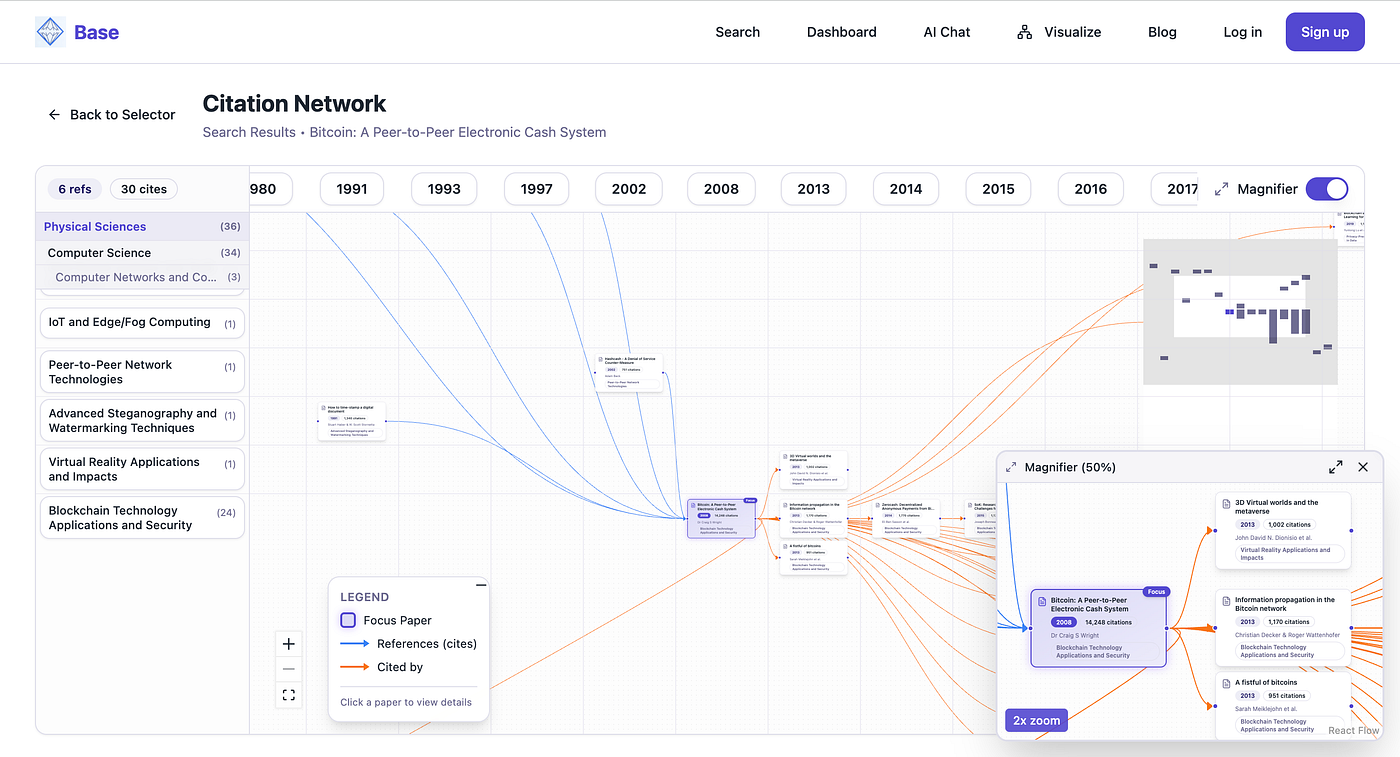
A paper’s citation network: references flow in from the left, citing works extend to the right
Time flows left to right
Papers are arranged chronologically, so you immediately see the temporal structure of a research area. References appear to the left of your focus paper; citing works appear to the right. The visual layout reveals patterns that lists obscure — you can see at a glance whether a paper drew from recent work or reached back to foundational research decades earlier.
Topics organized vertically
Papers are grouped by their research domain, field, subfield, and topic. A sticky header keeps you oriented as you navigate, always showing where you are in the taxonomy. This organization reveals cross-disciplinary influence — when citation lines cut across topic boundaries, you’re seeing ideas migrate between fields.
Zoomed view showing topic sidebar with domain/field/subfield/topic hierarchy, citation lines crossing between different topic rows
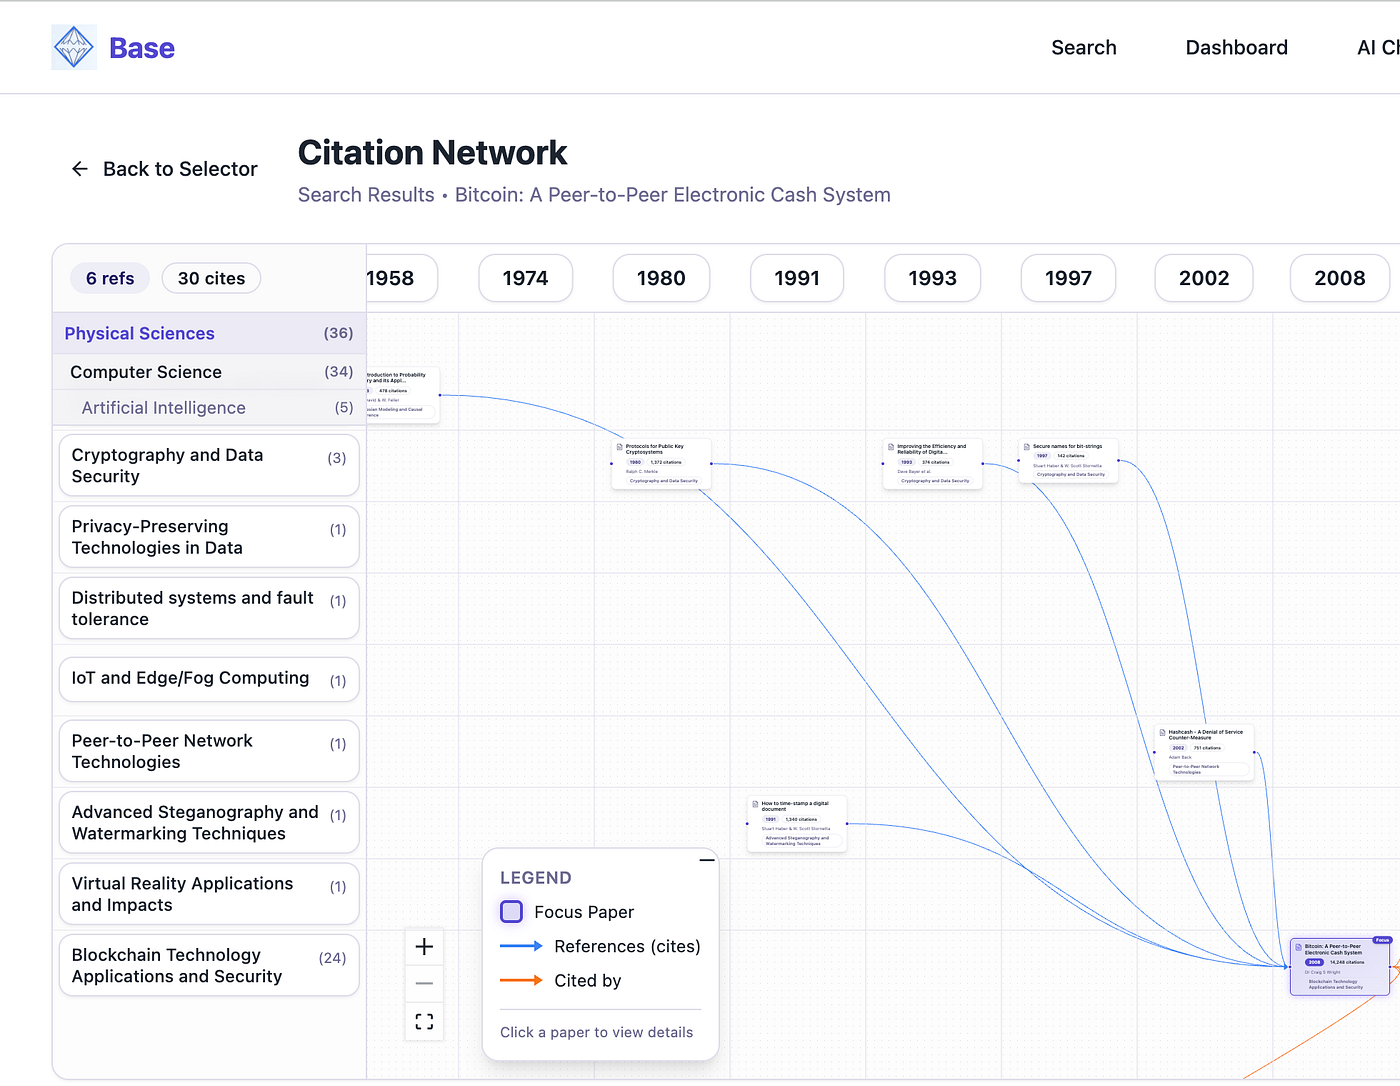
Citation lines crossing topic boundaries reveal interdisciplinary influence
Connections tell the story
Blue lines trace backward to references; orange lines trace forward to citing works. Following these connections shows you the intellectual lineage of ideas. Dense clusters of connections highlight the most influential nodes in the network.
Navigating Large Networks
Research networks can be sprawling. A well-cited paper might connect to hundreds of other works. Several features help you maintain orientation.
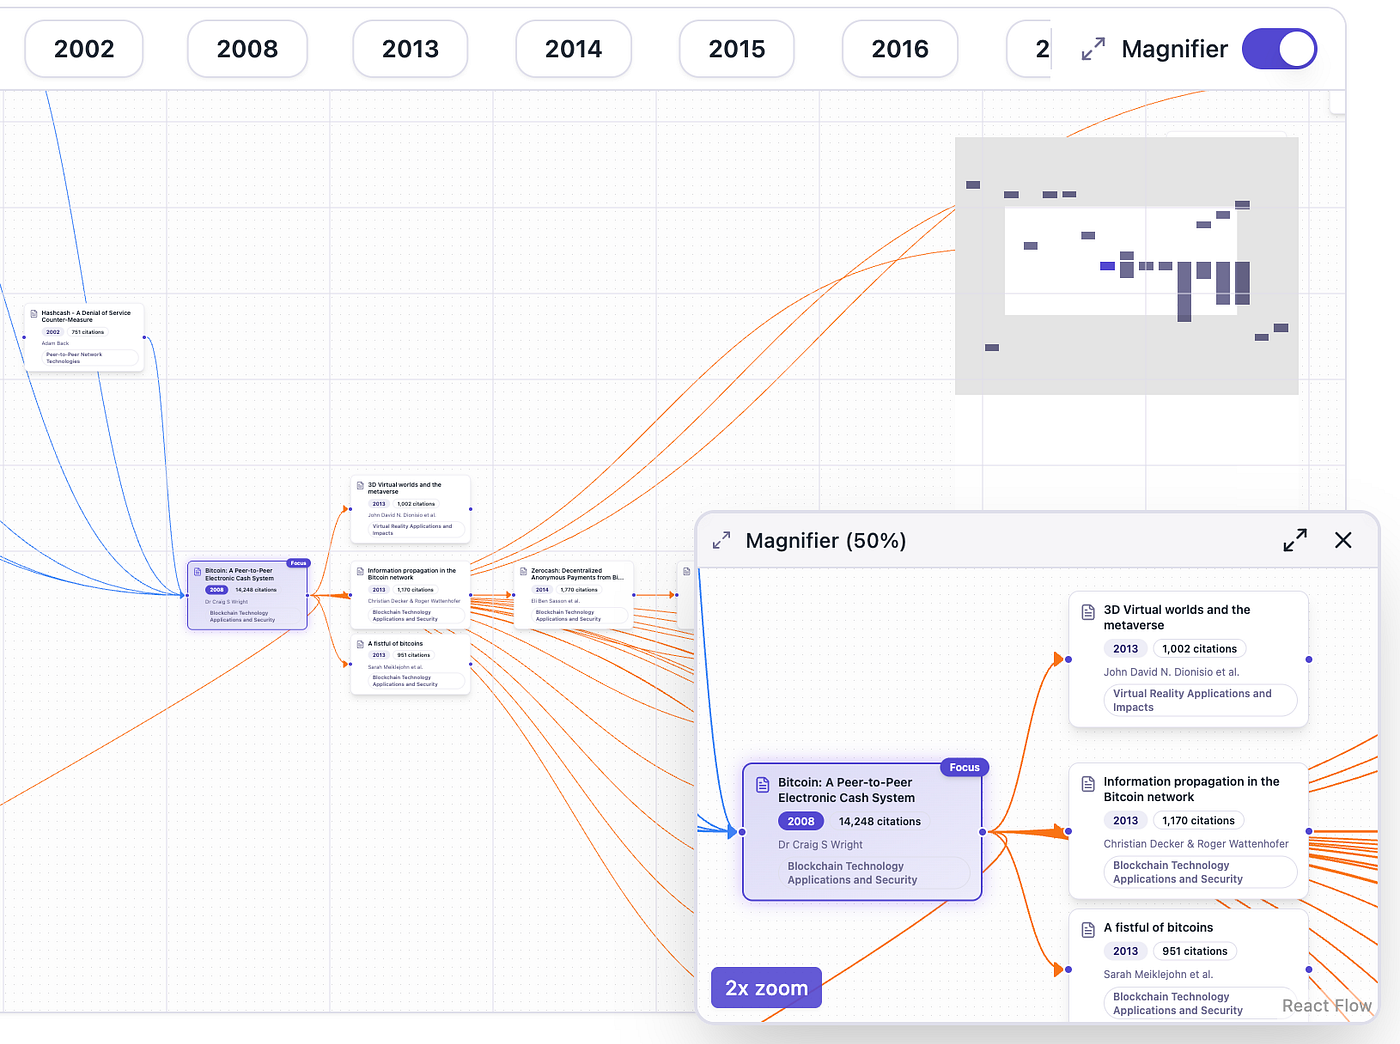
The minimap
A bird’s-eye view of the entire network. A highlighted rectangle shows your current viewport, and you can click anywhere on the minimap to jump to that region. It’s particularly useful for understanding the overall shape of a citation network before diving into details. Screenshot showing minimap in bottom-right corner with viewport rectangle highlighted, main canvas showing portion of larger network
The minimap provides overview while you explore details
The magnifier
Solves the zoom paradox. When you’re zoomed out to see the full network, individual paper titles become unreadable. When you’re zoomed in to read details, you lose context. The magnifier gives you both — a floating window that shows a 2x zoomed view of wherever your cursor is positioned. Toggle it on when you need to read titles while maintaining your overview perspective.
Dynamic topic labels
The sidebar stays synchronized with your view. As you pan and zoom, the hierarchy updates to show the domain, field, and subfield of papers currently visible. You always know where you are in the research landscape.
What Patterns Reveal
Once you start exploring citation networks visually, certain patterns become immediately apparent.
Foundational vs. incremental work. Papers with many outgoing orange lines (heavily cited) that connect to diverse topics are often foundational contributions. Papers that cite many references but have few citations might be comprehensive reviews or newer work that hasn’t yet accumulated citations.
Disciplinary bridges. When you see citation lines crossing multiple topic rows, you’re looking at interdisciplinary influence. These bridges often represent innovative applications or theoretical connections between fields.
Research trajectories. The temporal layout reveals how quickly ideas spread. Some papers are cited immediately and intensively for a few years. Others accumulate citations slowly over decades. The visual pattern tells you something about the nature of the contribution.
Clusters and gaps. Dense regions of the network indicate active research areas. Sparse regions might represent opportunities — questions that haven’t been fully explored or connections that haven’t been made.
From Overview to Insight
The visualization isn’t meant to replace reading papers — it’s meant to help you decide which papers to read and in what order. Start with the overview, identify the structural patterns, then drill down into the specific papers that occupy key positions in the network.
A paper that bridges two topic clusters might be worth reading even if its title didn’t initially catch your attention. A heavily-cited older paper that you hadn’t encountered might fill a gap in your understanding. A recent paper positioned at the edge of the network might represent the current frontier of the field.
The goal is informed navigation. When you can see the shape of a research conversation, you can participate in it more effectively.
Try It Yourself
Search for any paper in our index of 240+ million works. Click “Visualize Citations” to explore its intellectual context — the works it builds on and the research it inspired.
See where ideas come from. See where they go.
Join Purna on Peerlist!
Join amazing folks like Purna and thousands of other builders on Peerlist.
0
5
1