What Your LLM API Isn't Telling You About Token Probabilities
And why to be careful with API LLM response data
When you call the OpenAI API, you can ask for log-probabilities alongside the generated text. These logprobs tell you how confident the model was in each token it picked. People use them for all kinds of things — calibration, hallucination detection, uncertainty estimation, compression benchmarks.
But the API only gives you the top 20 tokens per position. The model's vocabulary is 200,000+. So you're seeing about 0.01% of the distribution and hoping the rest doesn't matter.
I wanted to know: does it?
The short answer
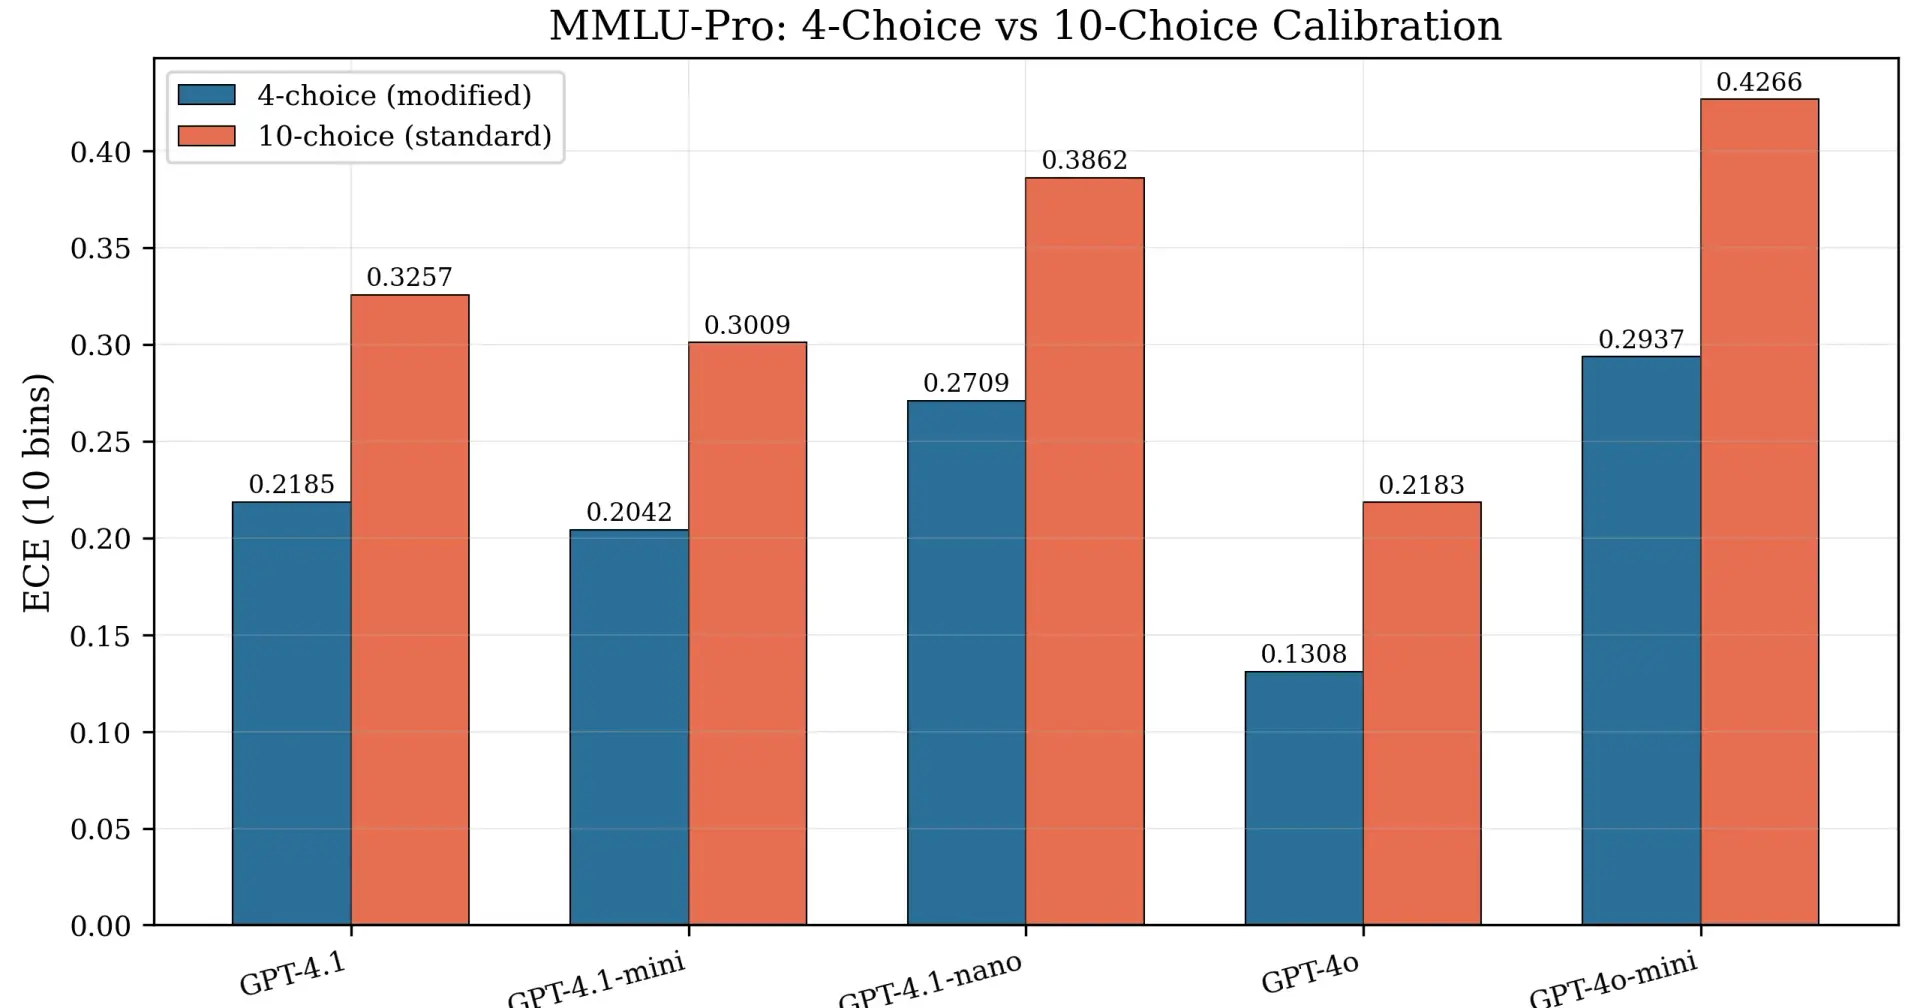
For multiple-choice questions (pick A/B/C/D), the answer is no.
Truncation doesn't matter at all. The calibration error is literally identical whether you use 5 tokens or 99,000.
For open-ended text generation, yes. At the standard API limit of k=20, about one in five tokens is losing more than 1% of its probability mass. That's enough to mess up entropy estimates and perplexity calculations.
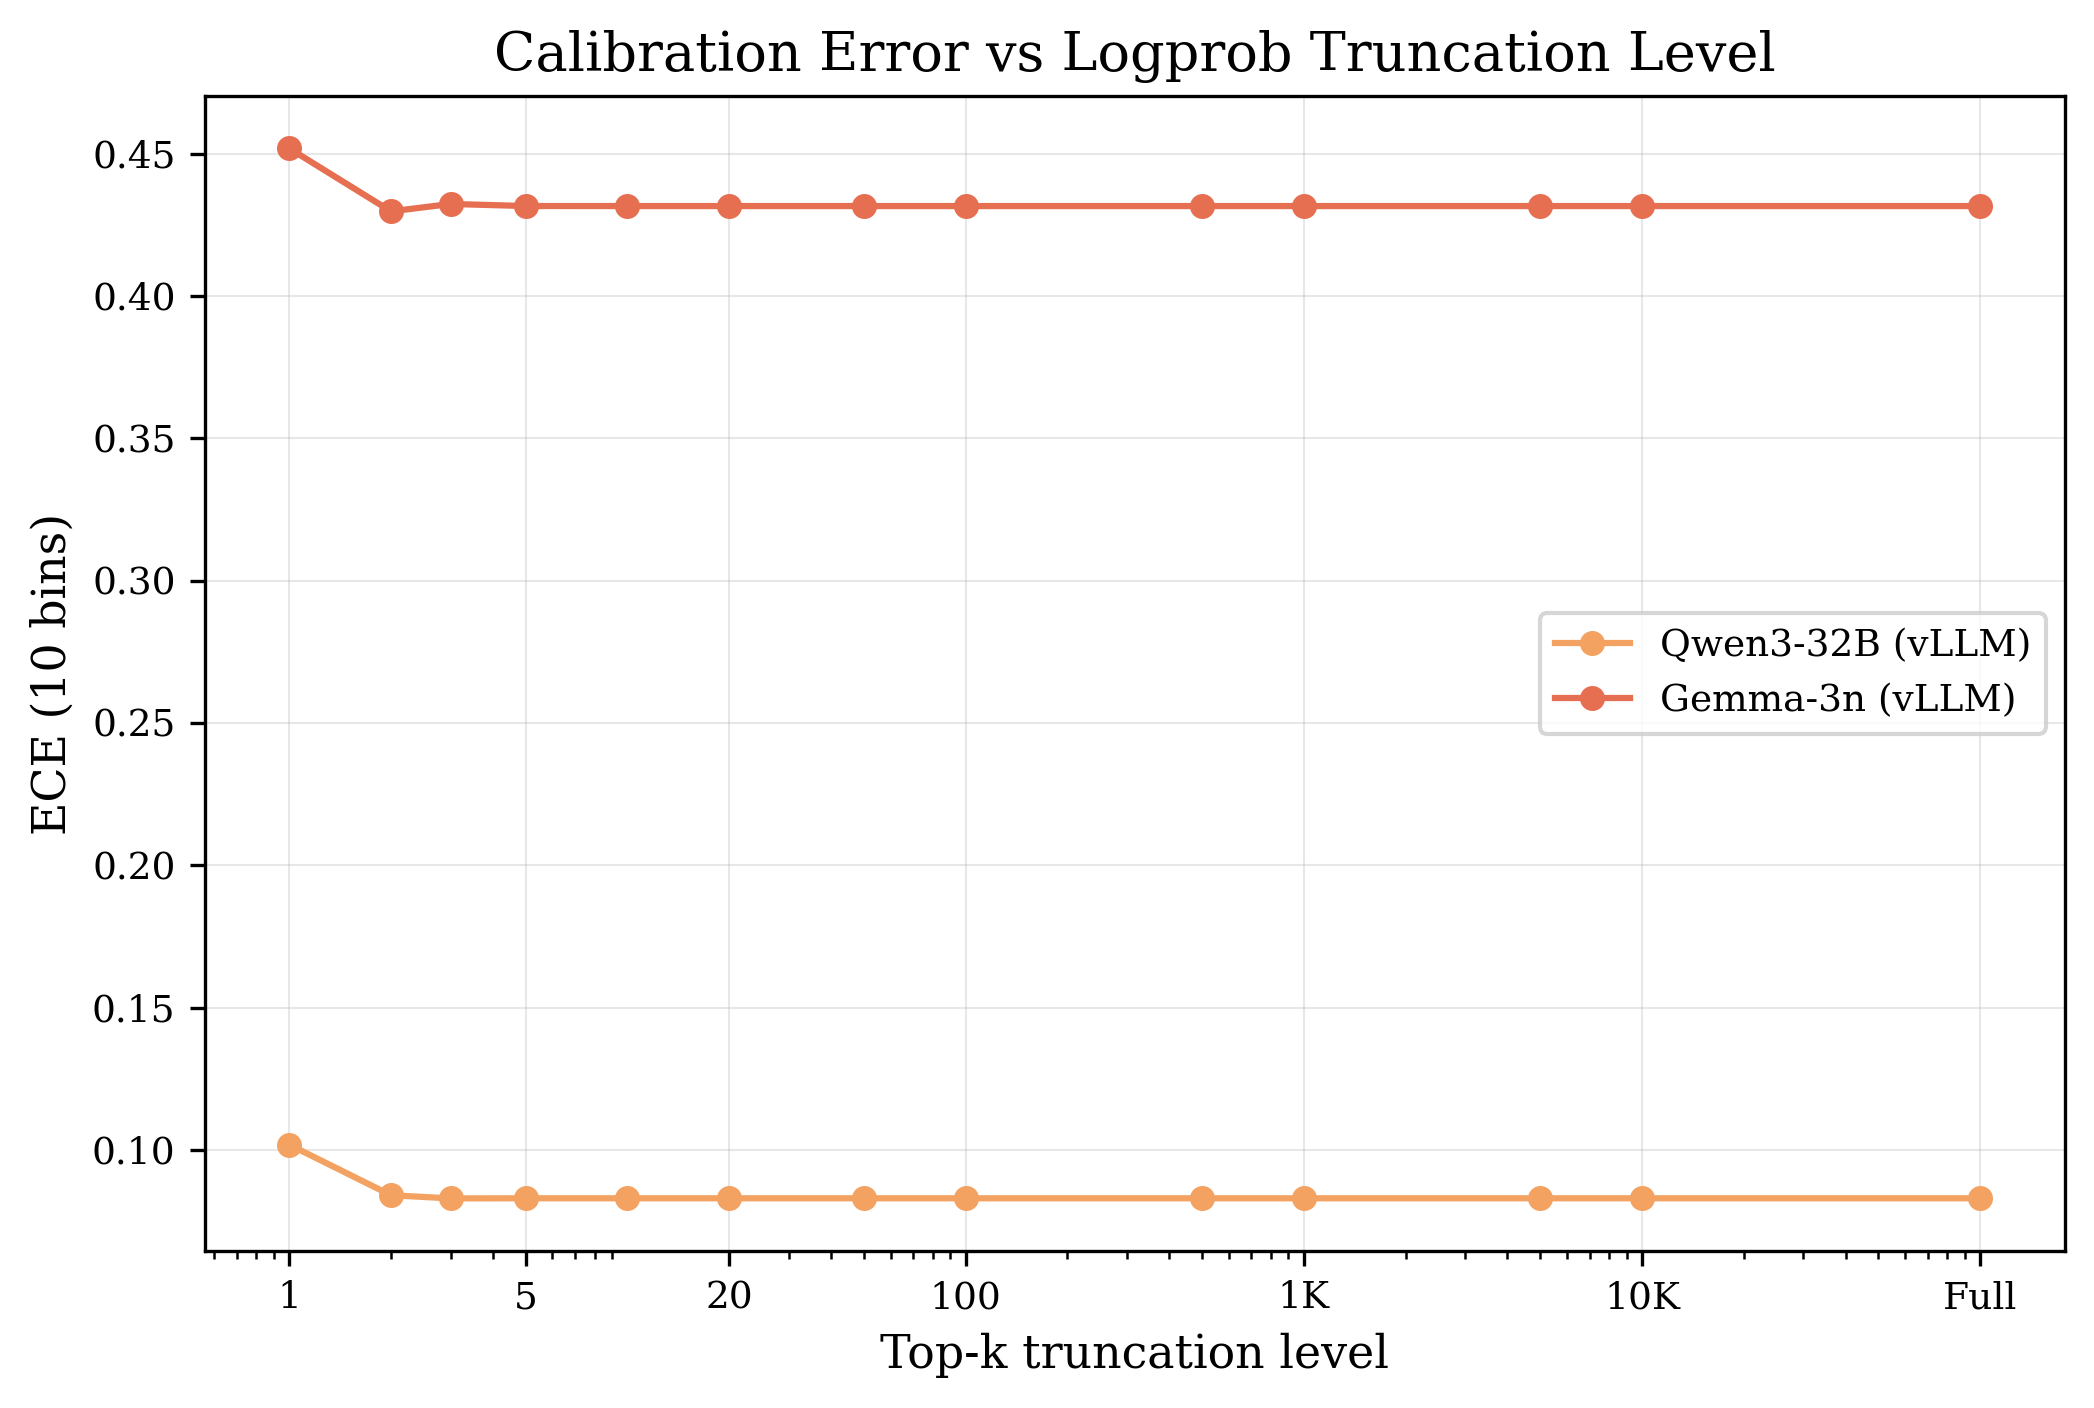
Calibration error vs. truncation level for two models with access to ~99K logprobs via vLLM. The line is flat from k=5 onward. Top-5 is enough for multiple-choice.
How I tested it
I self-hosted four models on H100 GPUs using vLLM, which lets you request up to ~99K logprobs per position (basically the full vocabulary). Then I artificially truncated those logprobs at k=1, 2, 3, 4, 5, 10, 20, 50, 100, 500, 1K, 10K, and full — and recomputed calibration at each level.
For multiple-choice, I used formal equivalence testing (TOST) to actually prove the effect is zero, not just say "it looks the same." All four models passed at p < 0.001 with a margin of 0.02 ECE.
For open-ended, I ran 140 text completions with 1,000 logprobs per position and measured the missing mass at each truncation level.
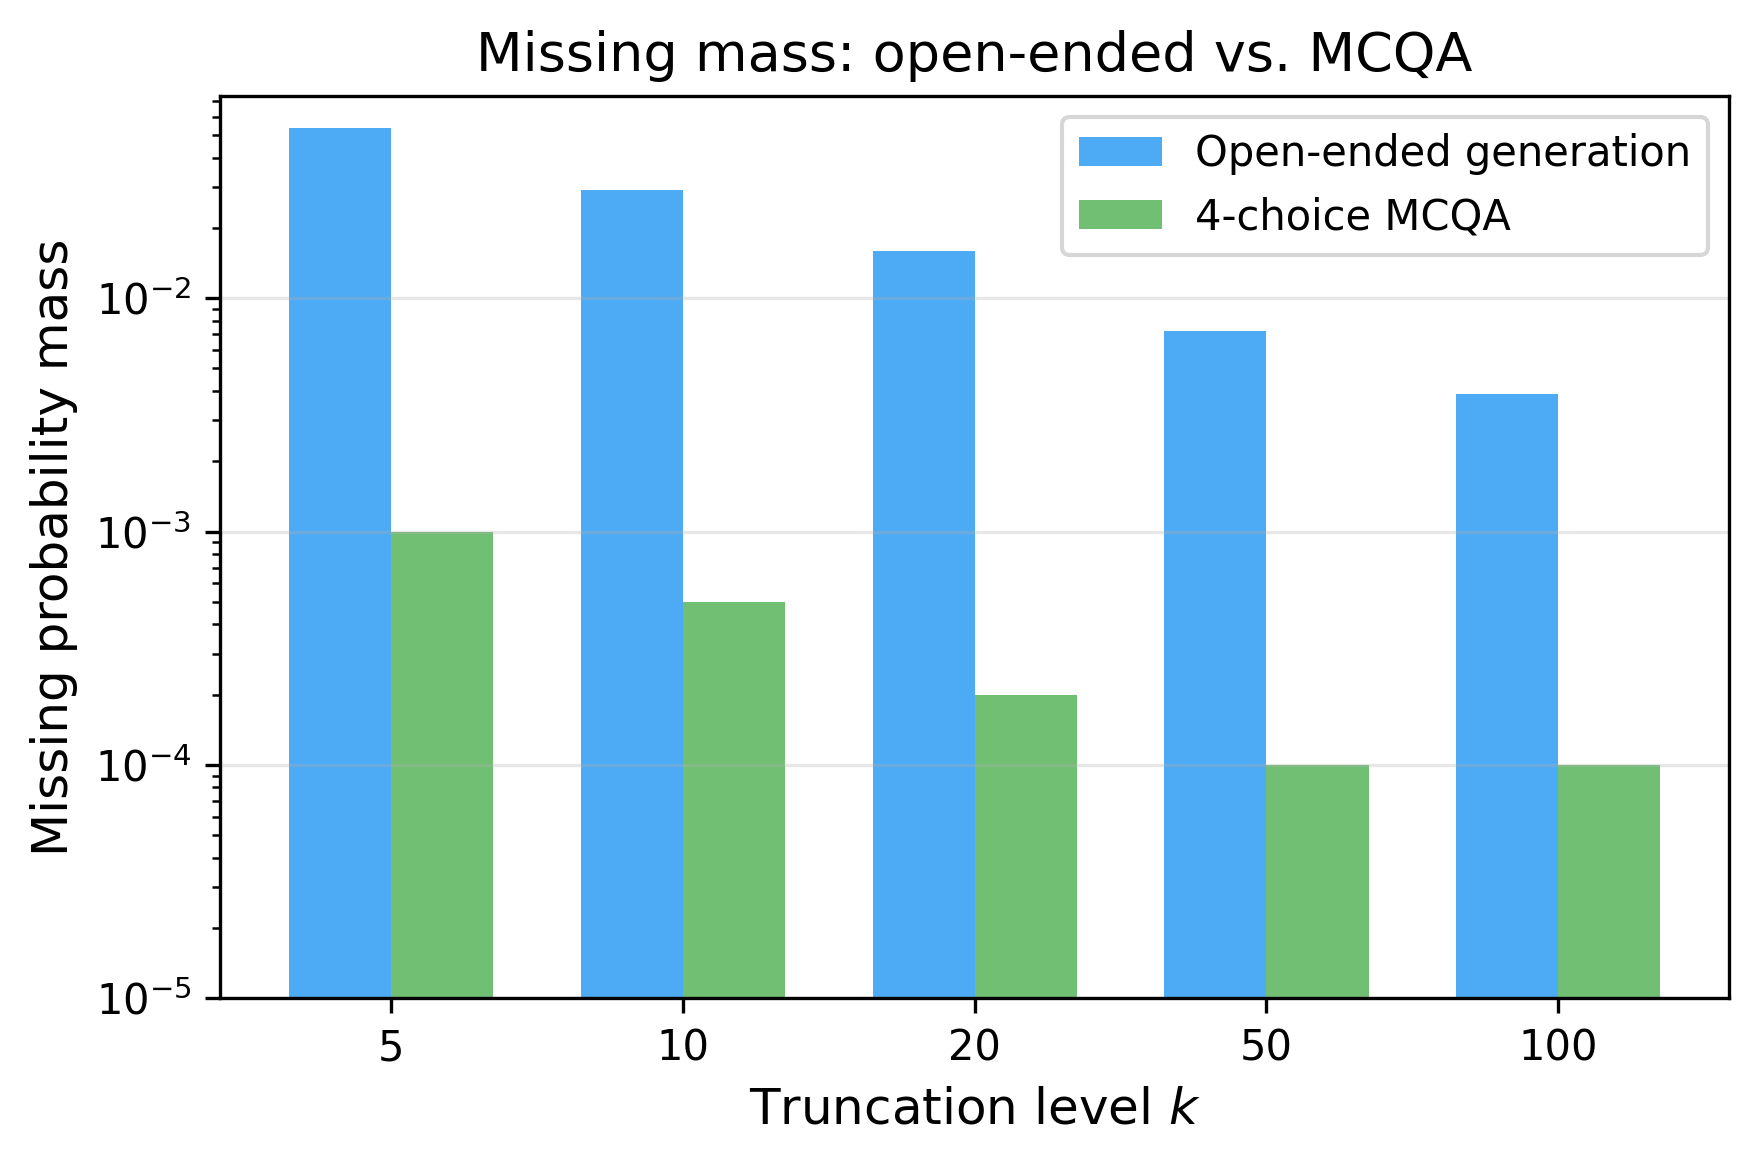
Missing probability mass: open-ended vs. MCQA. The y-axis is log scale. Open-ended generation has 100x more missing mass at every k.
The thing that actually matters
Here's what surprised me. Truncation is a non-issue for MCQA, but calibration still varies wildly across models. I tested 11 models across OpenAI, Together AI, Groq, and vLLM. The best model (Qwen3-235B) had an ECE of 0.066. The worst (Gemma-3n-E4B) had 0.564. That's a 9x range.
Here are Reliability diagrams for 12 model-provider conditions. Some hug the diagonal. Some don't.
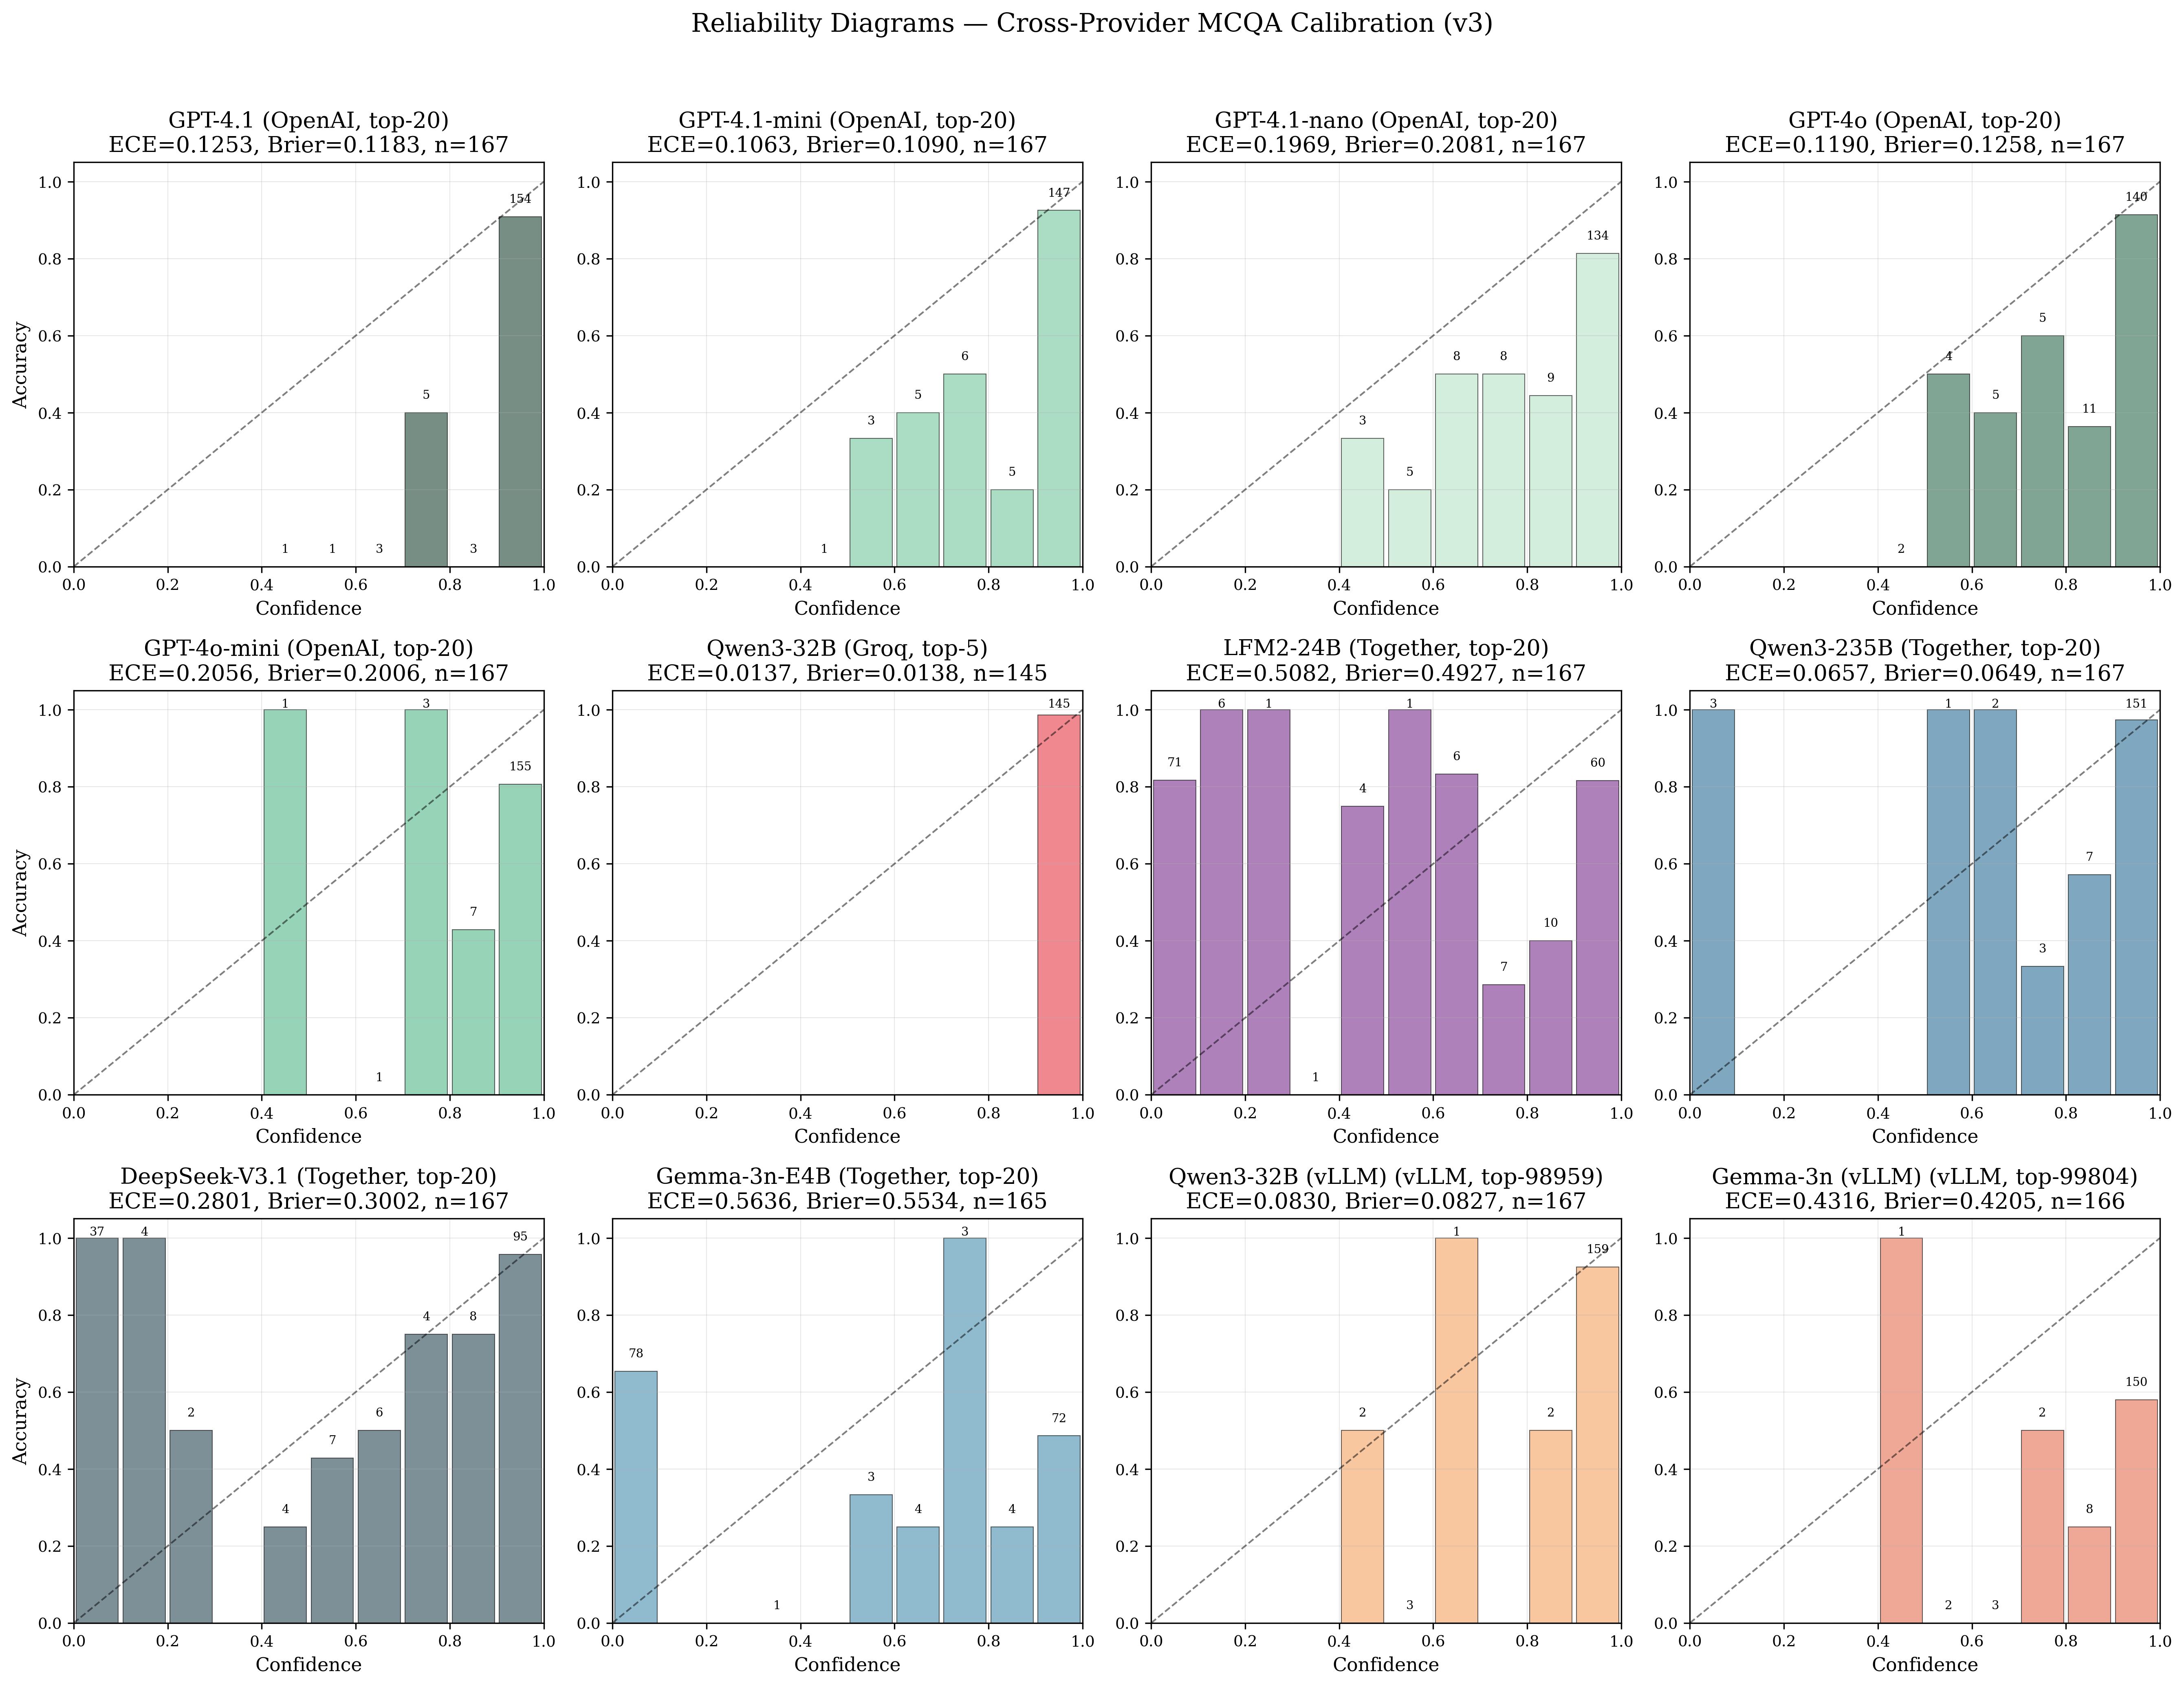
Reliability diagrams across 12 model-provider conditions on 167 questions. A perfectly calibrated model would have bars on the dashed diagonal. Some models are close. Others are way off.
And then I tested on harder questions (GPQA Diamond, graduate-level science) and everything got worse. Models that looked great on my easier benchmark fell apart. Llama-3.3-70B was the most extreme: 91% average confidence, 39% accuracy. It was basically saying "I'm sure!" on every question and getting most of them wrong.
149 out of 197 predictions crammed into the highest confidence bin, but accuracy is only 41%.
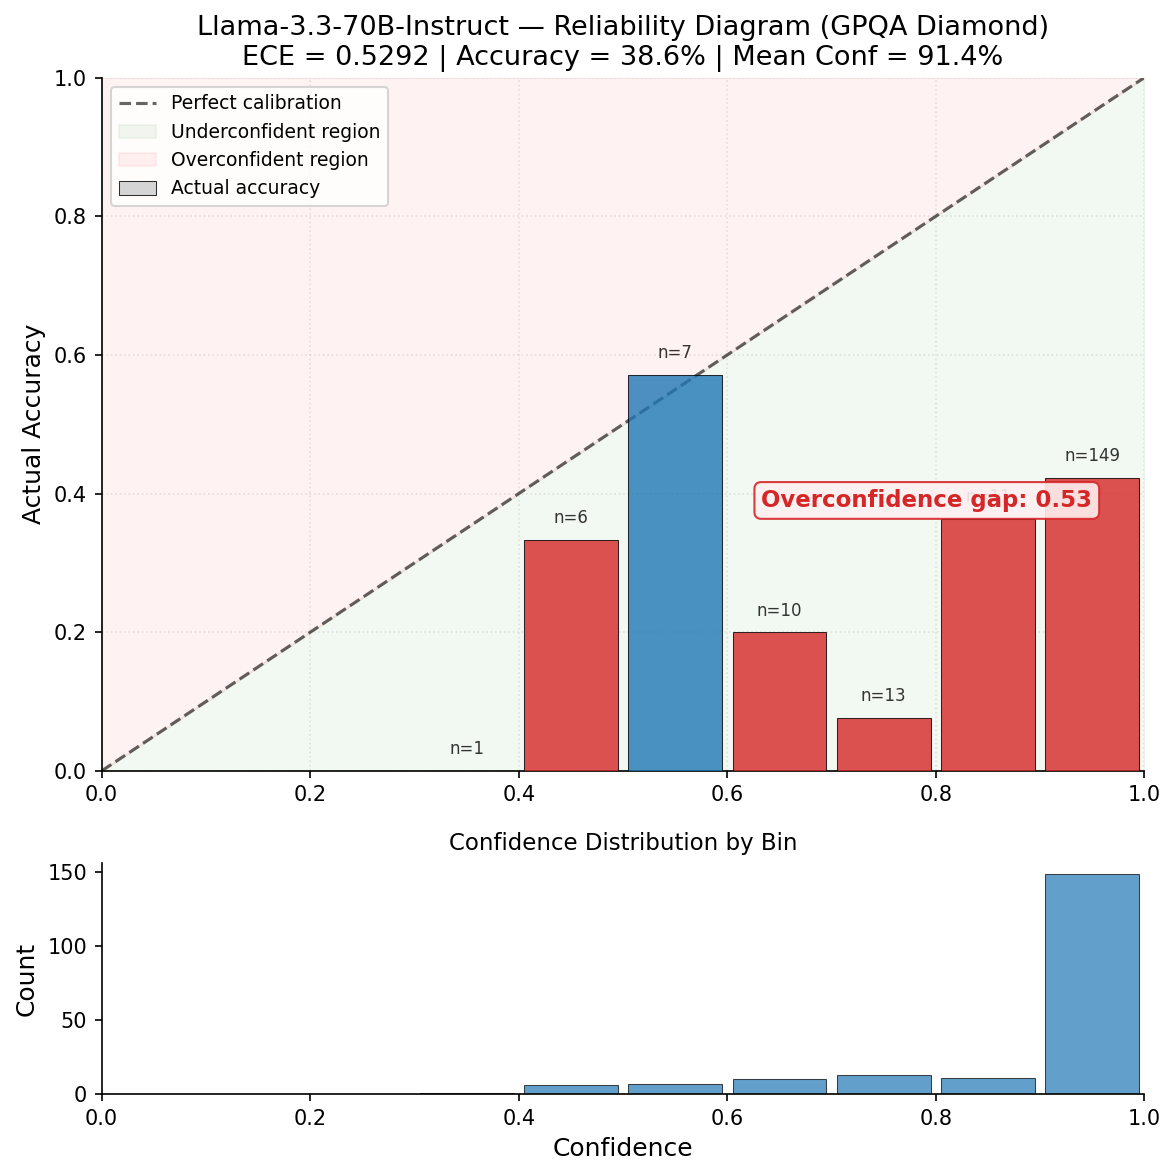
Llama-3.3-70B on GPQA Diamond. The bottom histogram shows almost all predictions are in the 90-100% confidence bin. The top chart shows actual accuracy around 40%. That's a 0.53 overconfidence gap.
logprobe
All of this research runs on a tool I wrote in Rust called [logprobe](https://github.com/Robby955/logprobe). It reads logprob data from (available) providers and tells you what's wrong with it.
It catches things that will silently break your analysis:
- Missing mass: how much probability is invisible due to truncation (GPT-4o-mini at top-20: 1.15%. GPT-2 at top-5: 30%.)
- Raw logits: some APIs return unnormalized logits instead of log-probabilities. The numbers look similar but every downstream metric is garbage. logprobe detects this immediately.
- Entropy bias: quantifies exactly how much truncation skews your entropy estimates.
It also does per-token entropy, confidence filtering, strict bits-per-byte (refuses to approximate byte counts from token strings because BPE makes that wrong), and terminal-colored output where tokens go green-to-red by confidence. cargo install logprobe to give it a try.
Logprobe Supports OpenAI, Together AI, Groq, Ollama, vLLM, and anything using the OpenAI-compatible format. Auto-detects the format, or you can specify it. JSON output for piping into other tools.
One more thing,
I also tested five different ways to aggregate per-token logprobs into a single confidence score for multi-token answers. Geometric mean, arithmetic mean, min-token, sequence probability, first-token-only.
The choice of aggregation method swings ECE by 0.15 to 0.29 per model — way bigger than any truncation effect. So if you're computing confidence over multi-token outputs, the formula you pick for combining token probabilities matters more than how many logprobs the API gives you.
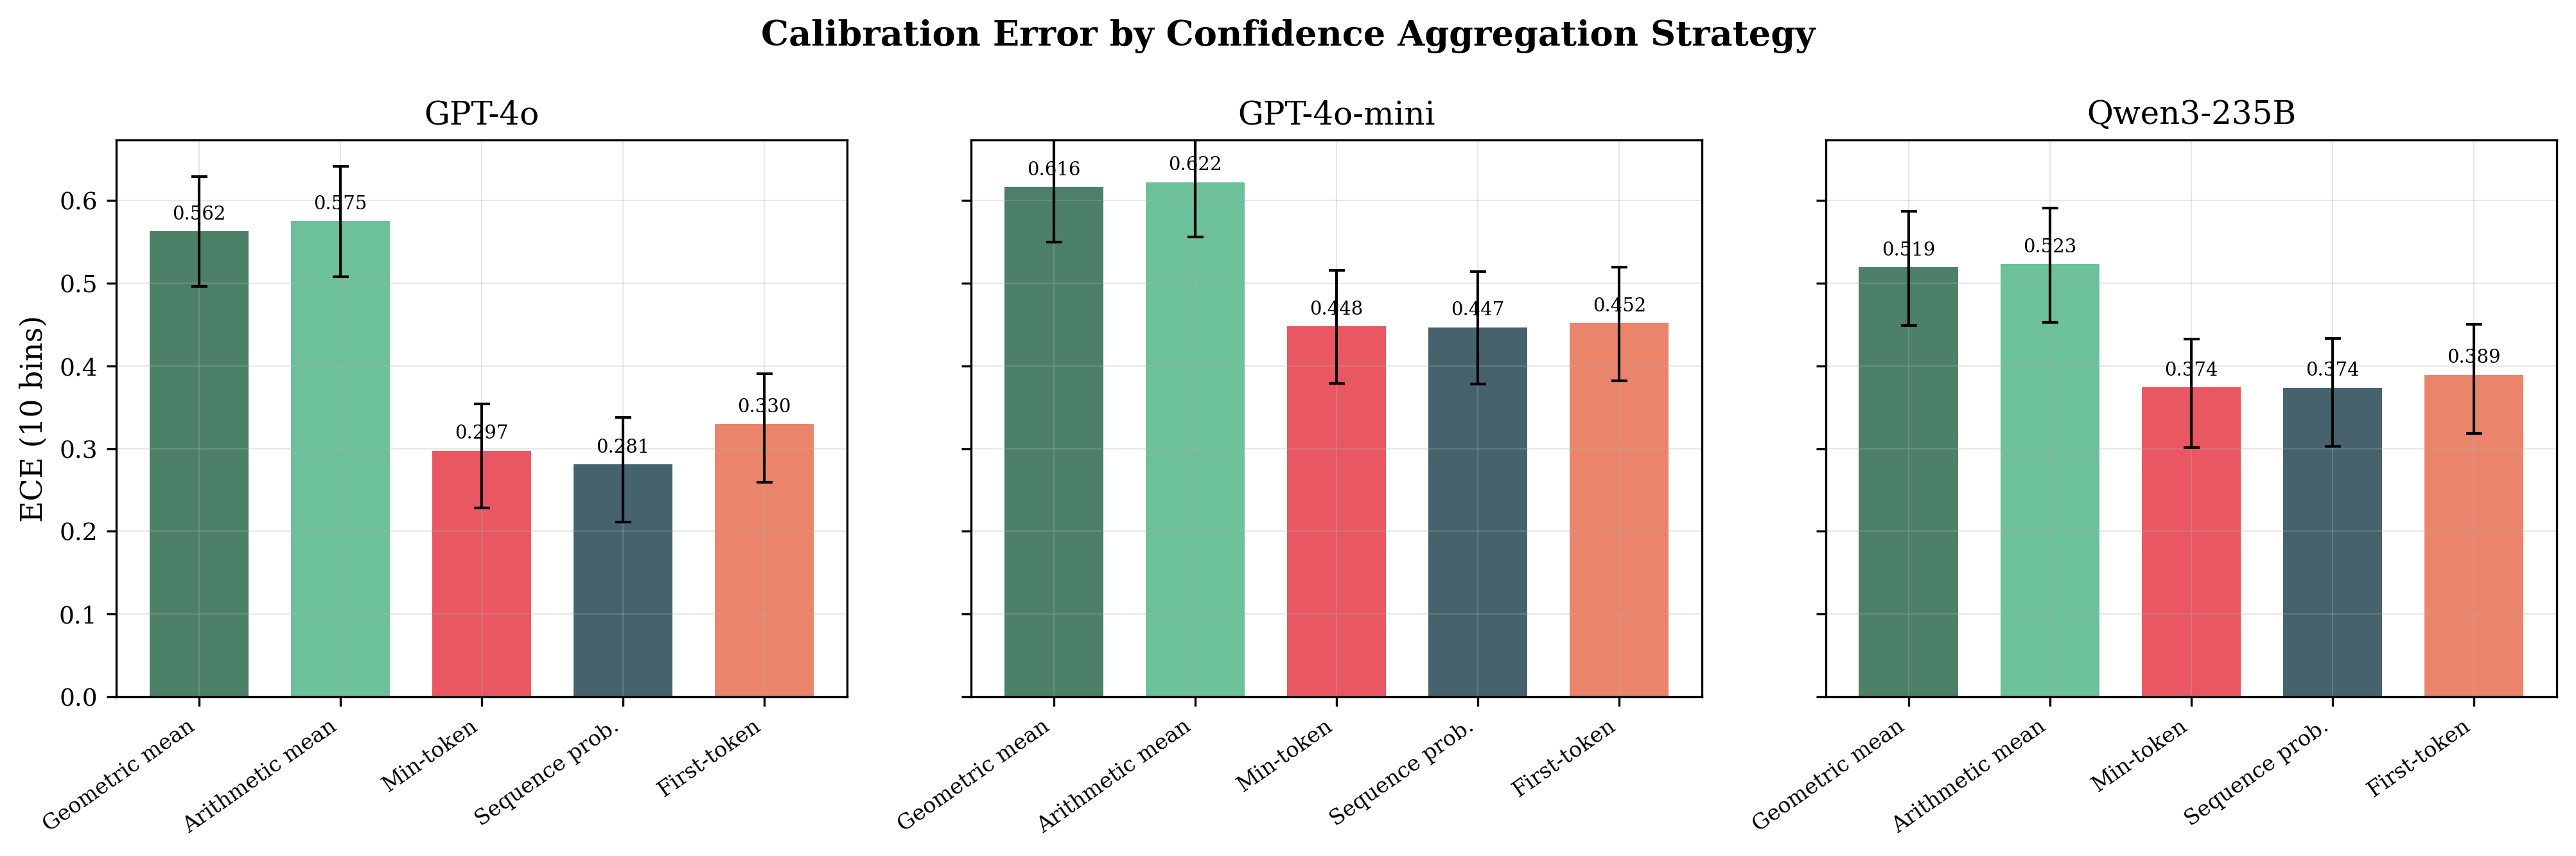
Same data, same models, five different ways to turn per-token logprobs into confidence. The gap between best and worst is enormous.
If you have any questions, comments, or suggestions, please feel free to comment or send me a message.
Rob
Links
- logprobe: [github.com/Robby955/logprobe](https://github.com/Robby955/logprobe) | [crates.io](https://crates.io/crates/logprobe)
- Paper: "Calibration Under API Logprob Truncation: Evidence from Multiple-Choice QA" (in prep)
- Research data: included in the logprobe-research repo (all 14,800+ data files, zero API calls needed to reproduce)
Join Robert on Peerlist!
Join amazing folks like Robert and thousands of other builders on Peerlist.
0
1
0