Churn Rate Calculator: Measure Customer Loss and Improve Retention
Customer growth alone does not define business success. Retention matters just as much. If customers leave faster than you acquire them, growth stalls.
The Churn Rate Calculator helps businesses clearly understand how many customers they lose over a specific period. It gives a quick and accurate churn percentage, which helps teams track retention health and take corrective action early.
The Problem With Tracking Churn Manually
Many teams still track churn using spreadsheets, notes, or rough estimates. This approach lacks consistency and often leads to unreliable data. As customer numbers grow, manual tracking becomes harder to manage and easier to break.
Common problems include:
Incorrect customer counts due to manual entry errors or outdated records
Missed monthly trends because teams do not track churn in a structured way
Inconsistent calculation methods where different teams use different formulas
Delayed decision-making because reports take time to prepare and verify
Manual tracking also hides the real reasons behind customer loss. When churn numbers are unclear, teams cannot connect customer drop-offs with UX issues, poor onboarding, pricing concerns, or product gaps. This makes it difficult to take timely action.
Without a reliable churn metric, retention efforts become reactive instead of planned. Teams end up guessing instead of fixing the real problems that cause customers to leave.
Why Churn Rate Matters for Businesses
Churn rate shows how effectively a business retains its customers over time. It acts as a direct signal of customer satisfaction, perceived product value, and overall user experience. When customers leave, it often points to deeper issues that need attention.
Tracking churn helps businesses:
Understand customer loyalty and engagement by showing how many users continue to find value in the product
Identify early warning signs of product or service issues before revenue or growth slows down
Measure the impact of pricing, UX, and feature changes by comparing churn before and after updates
Predict revenue stability and long term growth by linking retention trends with recurring income
A rising churn rate signals problems that require immediate action. A stable or declining churn rate indicates strong retention, better user experience, and clear product-market fit.
What the Churn Rate Calculator Does
The Churn Rate Calculator simplifies how teams measure customer loss. It removes manual effort and ensures every churn calculation follows a consistent method.
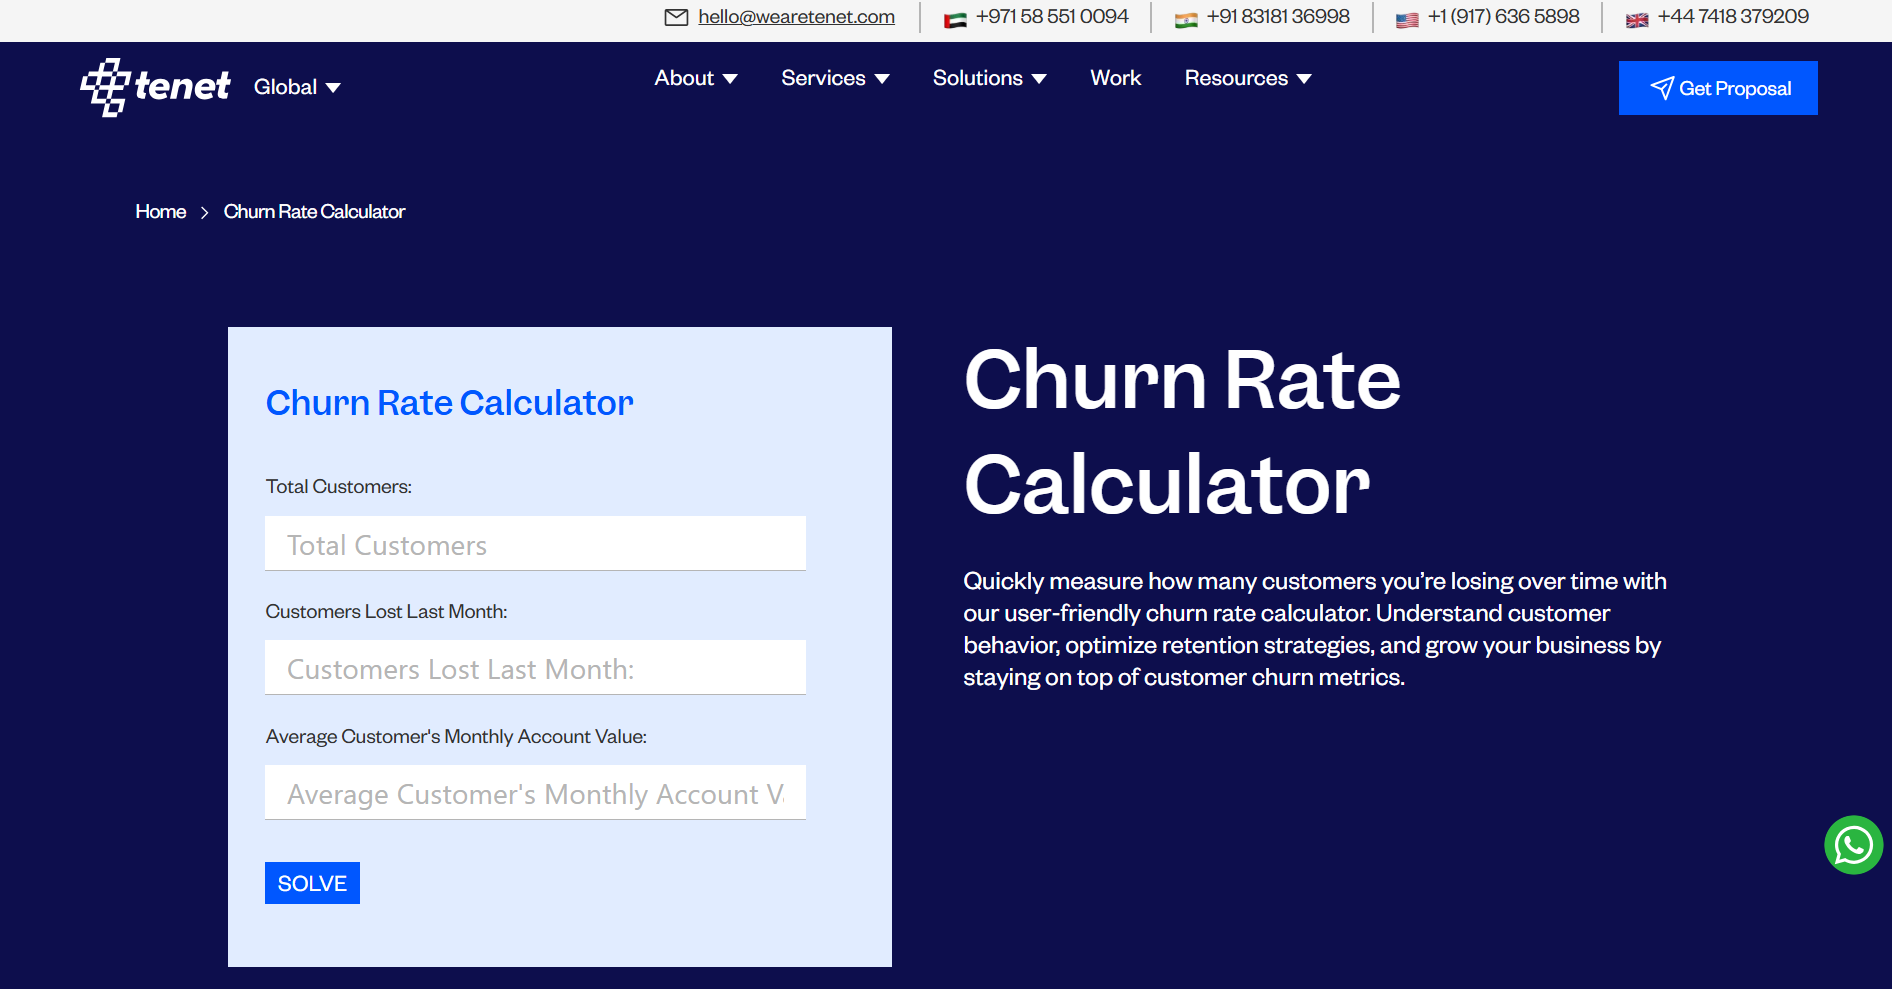
The calculator measures churn using three key inputs:
Total customers at the start of the period, which sets the baseline for calculation
Customers lost during the period, which captures actual customer drop off
Average customer monthly value, if required, to understand revenue impact
The tool then:
Applies the correct churn formula automatically, without manual input
Displays churn as a clear percentage, making it easy to understand at a glance
Eliminates calculation errors, which are common with spreadsheets
Delivers instant results, so teams can act without delay
This approach makes churn tracking fast, consistent, and reliable across teams and reporting cycles.
How to Use the Churn Rate Calculator
Step 1: Enter Total Customers
Start by adding the total number of customers you had at the beginning of the month. This number acts as the baseline for churn calculation and ensures accuracy.
Step 2: Enter Customers Lost
Next, enter the number of customers who stopped using your product or service during the same month. This includes cancellations, non renewals, or inactive users.
Step 3: Add Average Monthly Value
If applicable, enter the average monthly account value per customer. This helps teams understand the revenue impact of churn alongside the churn percentage.
Step 4: View the Result
The calculator instantly displays your churn rate as a percentage. This gives a clear view of customer loss for the selected period.
This simple step by step process helps teams track churn consistently, spot trends early, and take timely action without added complexity.
Key Use Cases for the Churn Rate Calculator
1. SaaS Retention Tracking
SaaS businesses depend on recurring revenue, where retention plays a critical role in growth. Even a small increase in churn can lead to significant revenue loss over time.
The churn rate calculator helps SaaS teams:
Track monthly and annual churn with accuracy
Monitor retention trends across time periods
Measure the impact of new feature releases
Evaluate onboarding and user activation performance
This clarity allows teams to focus on improving retention instead of only increasing acquisition.
2. Product and UX Improvement Decisions
High churn often signals problems in user experience or unclear value delivery. Churn data helps teams understand where users disengage.
Teams can use churn insights to:
Identify friction points in key user journeys
Validate the effectiveness of UX or UI changes
Measure retention before and after product redesigns
This turns churn from a negative metric into a useful product feedback signal.
3. Revenue and Growth Planning
Churn has a direct impact on revenue stability and long term growth. Without accurate churn data, financial planning becomes unreliable.
With clear churn numbers, teams can:
Predict customer lifetime value more accurately
Set realistic growth and revenue targets
Balance spending between customer acquisition and retention
This leads to stronger and more predictable financial planning.
4. Marketing and Customer Success Alignment
Marketing focuses on acquiring users, while customer success focuses on retaining them. Churn data connects these efforts.
The churn rate calculator helps teams:
Measure retention by campaign, channel, or cohort
Evaluate the quality of acquired users
Improve targeting, messaging, and onboarding flows
This alignment creates sustainable growth instead of short term gains.
What Is a Good Churn Rate?
A good churn rate depends on the industry, pricing model, and customer behavior. There is no single benchmark that fits every business, but lower churn always signals stronger retention and healthier growth.
In general:
SaaS businesses aim for annual churn below 5 percent, as recurring revenue depends heavily on long term customers
Telecom businesses target monthly churn between 1 and 2 percent due to high competition and switching behavior
Retail and subscription services often aim to keep churn below 10 percent
Tracking churn regularly helps businesses compare performance against industry benchmarks and identify when retention needs attention. A declining churn rate reflects better customer experience and stronger product value.
Who Should Use This Tool
The Churn Rate Calculator is useful for teams across the business, not just analytics or finance.
It supports:
SaaS founders and leaders who need clear visibility into retention health
Product and UX teams working to reduce friction and improve user experience
Growth and marketing teams measuring acquisition quality and retention impact
Customer success managers focused on reducing cancellations and improving engagement
Finance and strategy teams planning revenue and long term growth
Anyone responsible for retention, growth, or revenue can benefit from clear, consistent, and reliable churn insights provided by this tool.
Final Thoughts
Customer retention drives sustainable growth. Without tracking churn accurately, teams cannot understand why customers leave or how to stop it.
The Churn Rate Calculator gives businesses a simple and reliable way to measure customer loss. It removes manual errors, brings consistency to reporting, and helps teams act on real data instead of assumptions.
By tracking churn regularly, businesses can improve product experience, strengthen customer relationships, and build predictable revenue. If retention matters to your growth strategy, this tool should be a core part of your decision making process.
Join Shantanu on Peerlist!
Join amazing folks like Shantanu and thousands of other builders on Peerlist.
0
0
0