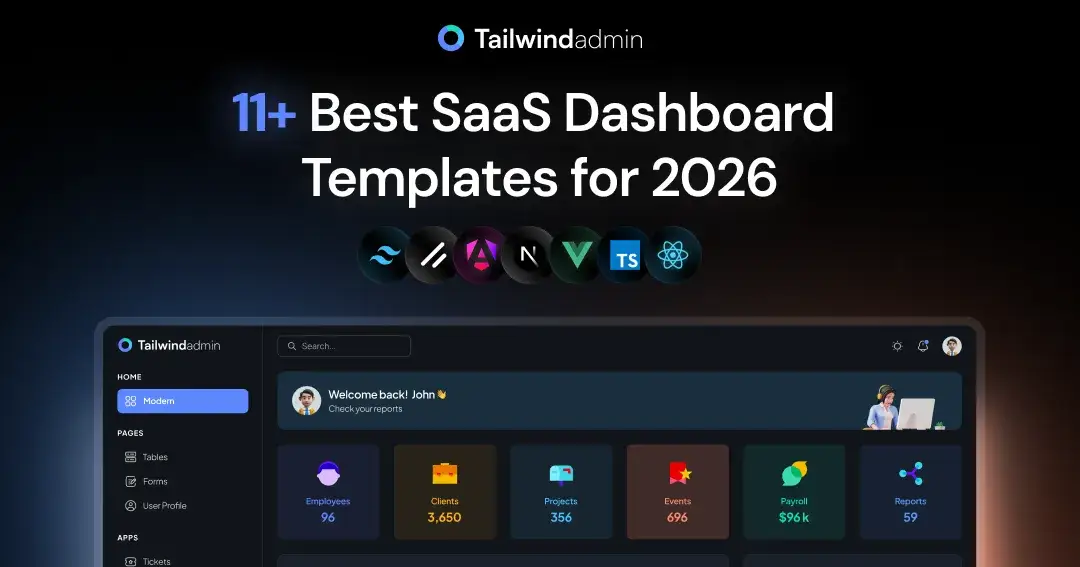
11+ Best SaaS Dashboard Templates for 2026 (Top Picks + Dev Guide)
Modern SaaS products live and die by how clearly they show data. Founders, growth teams, and customers all depend on dashboards to track key metrics, understand website traffic, monitor conversion, and review analytics reports in one place.
For developers, the challenge is not charts. The challenge is structure, scale, and maintainability.
This guide lists 11+ SaaS dashboard templates that developers actually use to build:
Analytics admin dashboards
Website analytics dashboards
Sales dashboards
Ecommerce dashboards
Performance and reporting dashboards
How this list was evaluated
We evaluated these templates based on how teams build real SaaS analytics dashboards today:
Tech stack maturity (Next.js, React, Angular, Vue)
Data visualization patterns (charts, tables, overview reports)
Layout structure for analytics workflows
Ability to connect multiple data sources
Code organization and long-term maintainability
Adoption by teams building production SaaS apps
This is not a design showcase. This is a developer decision guide.
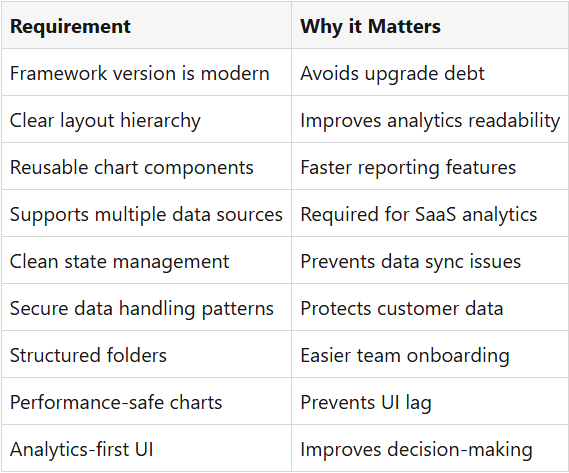
What Makes a Good SaaS Dashboard Template in 2026
A strong SaaS dashboard template should:
Handle real-time data without hacks
Scale with more charts and data sources
Keep layouts readable during long usage
Expose clear extension points for analytics logic
Support clean data visualization patterns
What to Look for Before Choosing a Dashboard Template?
Before picking any admin or analytics dashboard template, check the following.
Now, Let’s Look at the Best SaaS Dashboard Templates for 2026
With these requirements in mind, we can now review the 11+ best SaaS dashboard templates that meet real developer and analytics needs.
1. Tailwindadmin React
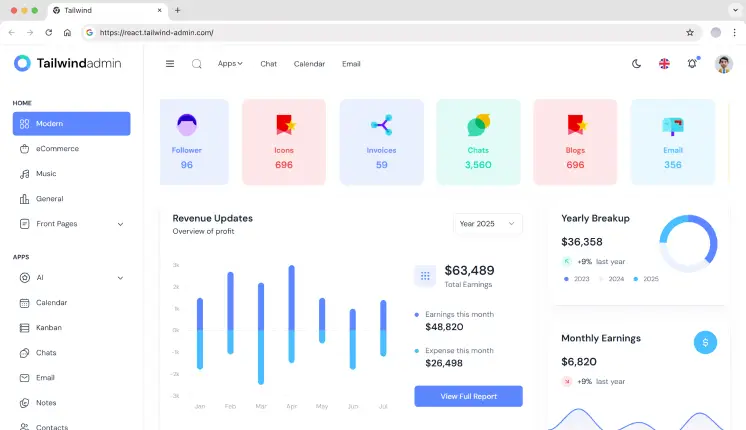
Tailwindadmin is a free, open-source dashboard template used for building SaaS analytics and website analytics dashboards, where developers own the data logic. The layout prioritizes metric grouping and predictable chart placement, making it easier to extend analytics without refactoring the UI.
Tech Stack: React.js, Shadcn UI, Tailwind CSS, TypeScript
Key Features:
100+ reusable UI components for admin flows
Built with React v19 and Tailwind CSS v4 for better compatibility
4+ pre-built dashboard layouts (Included Modern, eCommerce, Music, and General)
Apex Chart integration for real-time data visualization
2. MaterialM Tailwind Next.js
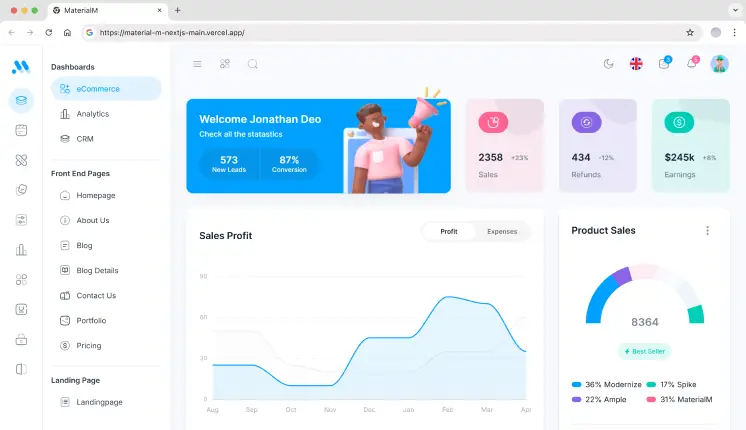
MaterialM is designed for teams building analytics admin dashboards with routing, SEO, and server rendering in mind. Best for SaaS products that expose analytics to customers and internal teams.
Tech Stack: Next.js, Headless UI, Shadcn UI, Tailwind CSS
Key Features:
Built using Next.js v16 for seamless server-side rendering and optimized performance
7+ analytics-focused dashboard layouts (Included Main, Dark, Horizontal, Mini Sidebar, RTL, Default, NextAuth)
Supports i18n (Internationalization) for React applications
Pre-configured chart patterns for key metrics
3. Matdash Next.js Tailwind
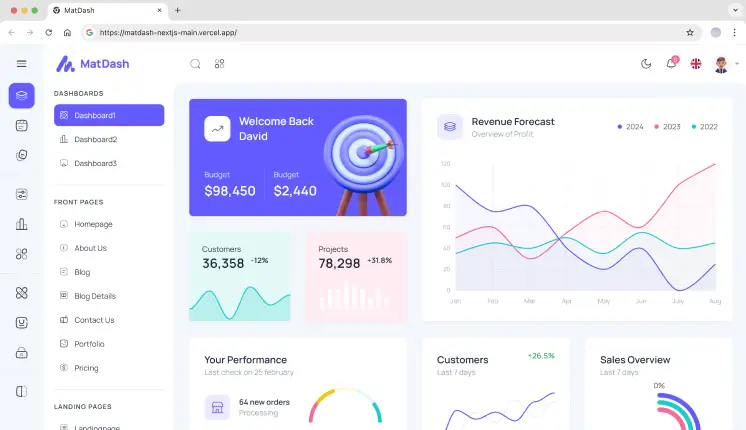
Matdash targets developers building data analytics dashboards where clarity matters more than decoration. Layouts are optimized for overview reports and conversion tracking.
Tech Stack: Tailwind CSS, Next.js, Shadcn UI, Supabase Auth
Key Features:
Built with Next.js v16 and Tailwind CSS v4 for efficient and real-time data handling
12+ Pre-built applications (Like Chat, eCommerce, Invoice, Kanban, Blog, and User Profile, etc.)
Centralized chart configuration
Optimized rendering for large datasets
Consistent spacing for KPI readability
4. Spike Angular
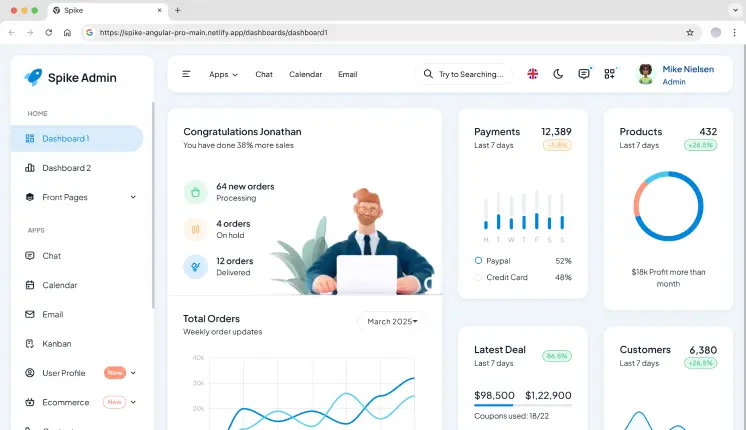
Spike Angular is built for enterprise SaaS teams that prefer Angular’s structure for performance dashboards and customer data management. Best for Enterprise SaaS analytics and internal reporting tools.
Tech Stack: Angular, Rxjs, Amcharts, Apex Charts, SaSS
Key Features:
Built with Angular v20 for dynamic and interactive dashboards
3400+ Material Angular Font Icons
Component-driven analytics views
Predictable data flow for reports
Long-term maintainability for large teams
5. Modernize React MUI
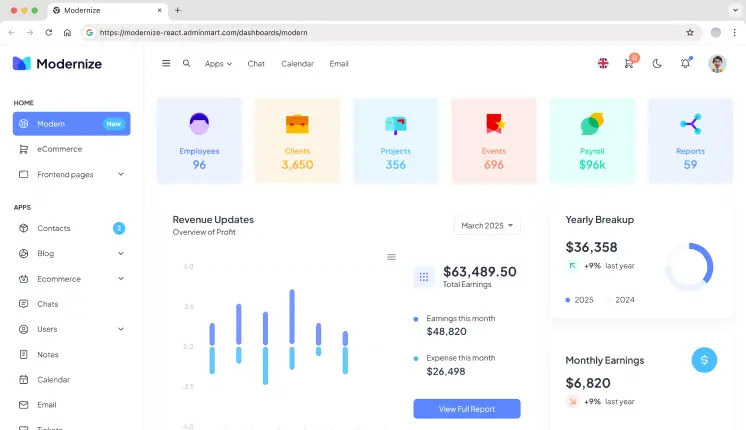
Modernize is suited for teams building interactive analytics dashboards where UI consistency and chart density matter. Best for Data analytics dashboards and sales dashboards.
Tech Stack: React, Vite, Material UI, JavaScript, TypeScript
Key Features:
Built with React v19, Vite v6, and MUI v7 for a fast & seamless user experience
6+ Pre-built Dashboard layouts & 45+ Dashboard UI components
Detailed charts that maintain readability
Strong component isolation
6. MaterialPRO Vue.js
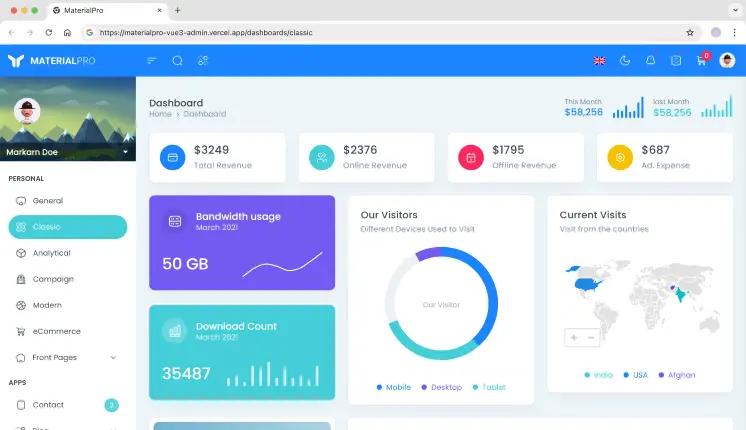
MaterialPRO Vue focuses on structured data visualization for teams using Vue to build SaaS admin dashboards. Best for Analytics dashboards in Vue-based SaaS products.
Tech Stack: Vue.js, Vuetify, Vite, Pinia, TypeScript
Key Features:
Built with Vue.js v3 for creating lightweight and maintainable applications
9+ Pre-built applications (Includes Chat, eCommerce, Contact, and Notes, etc.)
Pre-configured KPI sections
Component-level chart control
Stable structure for analytics growth
7. DashNext Next.js Tailwind
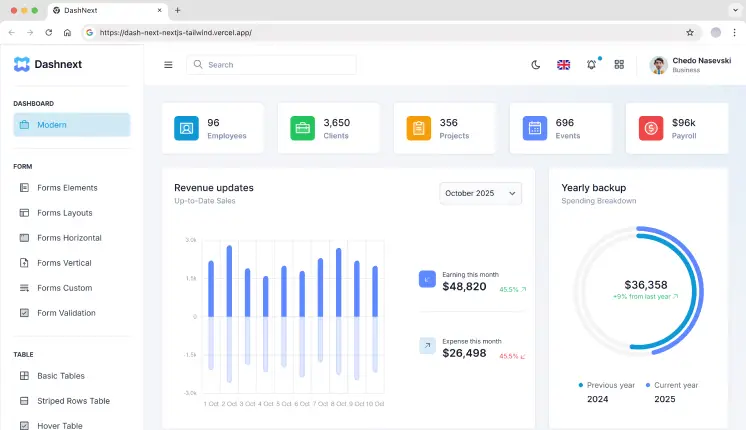
DashNext is minimal by design, making it suitable for teams that want to build custom analytics logic without fighting the UI. Best for Lightweight SaaS analytics and internal dashboards.
Tech Stack: Next.js, Tailwind CSS, React, Flowbite
Key Features:
Built with Next.js v15 and React v19 for powerful and flexible state management
Low abstraction for faster customization
Performance-safe UI patterns
Simple data source integration
8. Vora
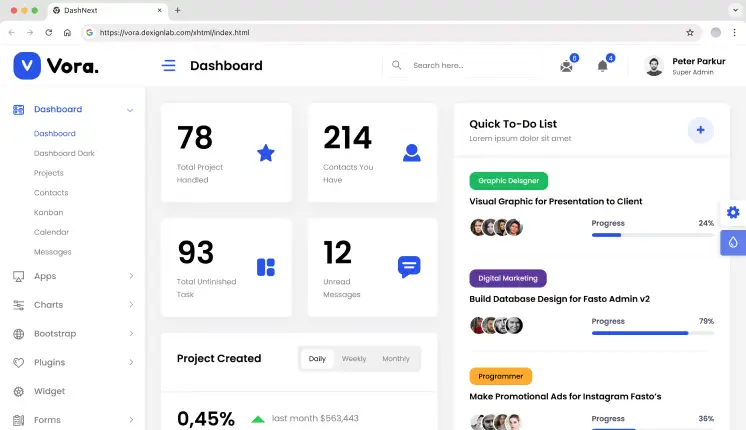
Vora is an HTML-based SaaS dashboard template used when teams need analytics dashboards without committing to a frontend framework. It works best for server-rendered reporting tools and backend-driven analytics where the UI layer stays thin.
Tech Stack: HTML 5, Bootstrap 5, JQuery
Key Features:
60+ Inner pages and 6+ Pre-built demo layouts
Chart-heavy report layouts optimized for static and server-driven data
No framework lock-in, allowing gradual migration to React or Vue if needed
Straightforward data binding for teams controlling analytics logic server-side
9. Open SaaS
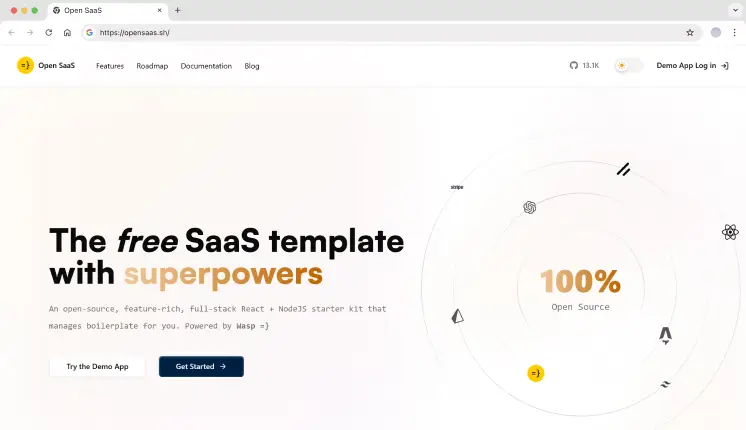
Open SaaS is a full starter kit used by teams building real SaaS analytics products, not just dashboards. This template comes with a ton of features out of the box.
Tech Stack: Astro, Wasp, Shadcn UI
Key Features:
Open-source with 13.1K+ GitHub stars
Deep integrations like Prisma
Production-ready analytics structure
Auth and data models included
Used by real SaaS teams
10. Argon Next.js
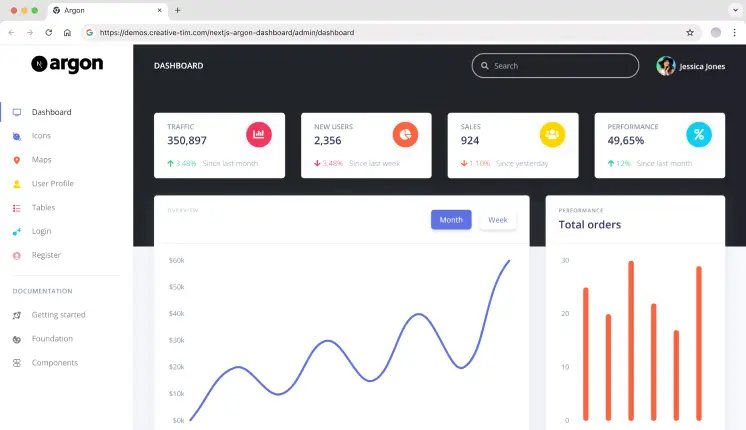
NextJS Argon Dashboard is built with over 100 individual components, giving you the freedom to choose and combine. All components can take color variations, which you can easily modify using SASS files.
Tech Stack: Next.js, Bootstrap, React
Key Features:
Clean admin layout
134+ GitHub stars
Analytics-ready chart sections
Minimal configuration
11. Chakra Next.js Dashboard
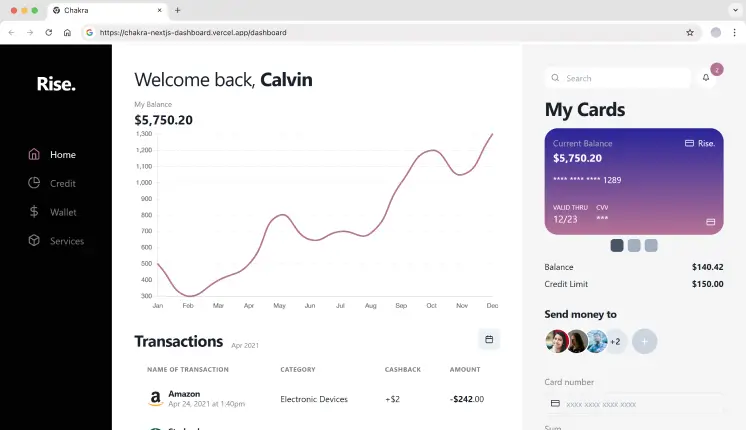
A responsive dashboard UI focused on accessibility and readable analytics layouts.
Tech Stack: Chakra UI, Chart.js, Next.js
Key Features:
Accessible chart layouts
102+ GitHub stars
Clean component API
Simple analytics integration
Frequently Asked Questions (FAQs)
1. Which dashboard stack scales best for SaaS analytics in 2026?
Next.js and React-based dashboards scale best for SaaS analytics because they handle large datasets, server rendering, and frequent KPI updates without UI performance issues.
2. Are free SaaS dashboard templates reliable?
Yes. Open-source templates like Tailwindadmin and Open SaaS are used by real teams when reviewed for security and data handling.
3. What should developers evaluate first in a dashboard template?
Framework version, chart performance, layout clarity for key metrics, and how easily new data sources can be added.
Final Thoughts
In 2026, a SaaS dashboard is not just a UI layer. It’s how teams track key metrics, understand real-time data, and make data-driven decisions. The templates listed above are chosen for how well they support analytics workflows, not for visual polish alone.
Pick a dashboard template that matches your tech stack, handles growing data sources, and keeps analytics readable as your product scales. A good starting structure saves months of rework later - especially in analytics-heavy SaaS products.
Join Vaibhav on Peerlist!
Join amazing folks like Vaibhav and thousands of other builders on Peerlist.
3
11
0