How to REALLY calculate attrition
Not every exit is the same
How is attrition calculated currently?
The current approach of calculating attrition is this:
Attrition Rate (%) = (Number of Exits x 100) / Average Headcount.
Let's take an example. Let's calculate the attrition % in a company - XYZ - for the year 2026. Assume that:
Total Headcount of XYZ on Jan 1, 2026 = 40
Total Headcount of XYZ on Dec 31, 2026 = 56
Therefore, Average Headcount for the year 2026 = (40 + 56) / 2 = 48
Now imagine that 5 people exited the company in the year 2026. In that case:
Exits in 2026 = 5
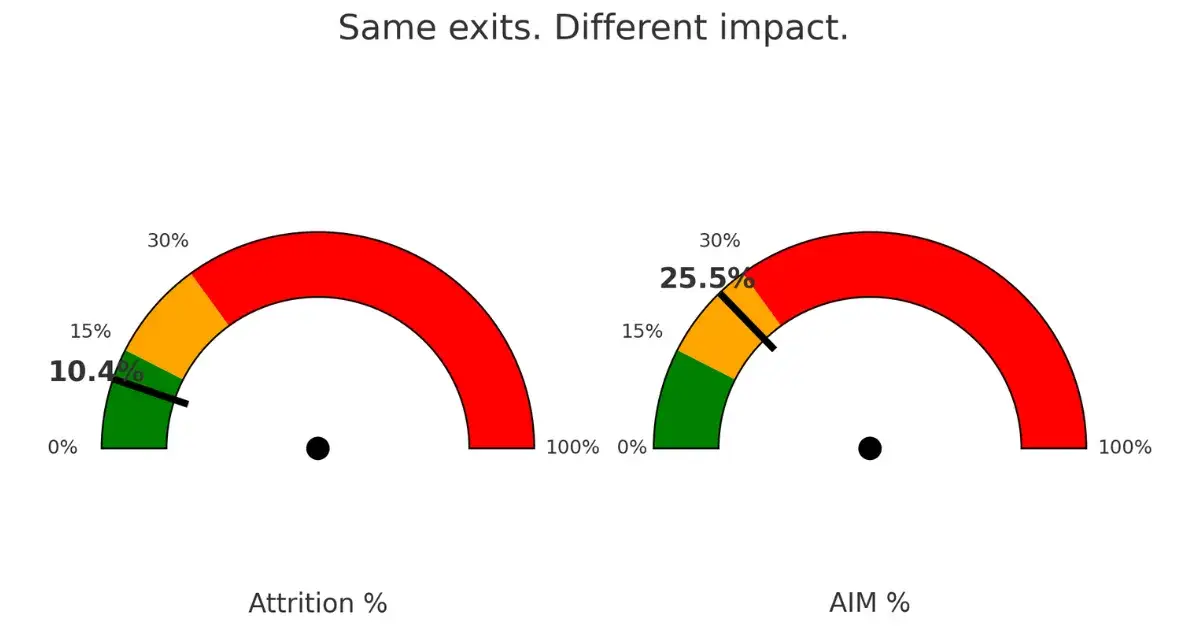
Therefore, Attrition = (5 × 100) / 48 = 10.41%
This is useful. But it ignores 2 important things:
How many of the exits were involuntary (i.e. the company asked them to put down their papers) and how many were voluntary (i.e. they resigned on their own will)? More importantly...
WHO left? And what is the impact?
Involuntary vs Voluntary attrition
There is a big difference between these two attritions and they need to be measured separately.
Involuntary attrition — When the company initiates an exit, it's usually due to performance or behaviour issues. In such cases, the attrition, in a way, is beneficial to the organisation. But if quite a few such exits get initiated by the company, it raises question marks on their recruitment function.
Are the recruiters and the interview panel aligned with the company's quality expectations? Or are they pushing selections to meet targets? Do they need to recalibrate their selection criteria?
Voluntary attrition — When an employee puts down their papers voluntarily, it's usually due to dissatisfaction with the company's culture, or projects, or leadership, or pay etc. And when many such exits happen, it raises a question mark on their non-recruitment functions.
Is the company's culture not good? Is the leadership not supportive? Are people feeling a lack of growth? Is the work not exciting enough? Is the pay not good enough?
Different root causes, different remedies. So, it's important to separate them.
Use Involuntary Attrition % (IVA for ease) to keep a tab on your recruitment function. The higher the IVA, the more need for your recruitment function to fix itself (...unless the company is doing restructuring / layoffs, which is a different conversation altogether...).
The missing piece - Impact
For our calculation, let us assume that all 5 exits are voluntary. This brings us to the most important point — Who all left? 🙂
Were these 5 people in very strategic, crucial leadership roles in the company? Were they highly tenured within the company? Because the impact of those exits will be much more severe than if these 5 were younger, less tenured, individual contributors.
And that is what is missing from current attrition calculations - the severity of impact caused by them!
So here is what I recommend — build an ATTRITION IMPACT METER (AIM)
Attrition Impact Meter (AIM) - How to build one
Alongside the traditional attrition calculator, keep a separate calculator which assigns WEIGHTS to each person exiting.
These weights will be directly proportional to multiple dimensions. I can think of the following dimensions immediately:
TENURE - When a tenured person leaves, you don't just lose a headcount.
You lose someone with hard-won project context;
you lose someone who was reliable & credible; and
you lose a beacon of your company's professional culture and ethos.
Even with a good handover, a replacement needs time to absorb domain knowledge, align to ways of working, and rebuild trust with teammates and clients. The longer the tenure, the bigger that gap. So the weight should rise with tenure.
ROLE CRITICALITY - If a Lead Engineer who sets the tech roadmap and leads the client engagement leaves, the impact is far greater than an individual contributor owning modules. You lose decision velocity, architectural continuity, and a trusted point of contact. The higher the role’s span of influence, the bigger the gap - so the weight should rise with role criticality.
CAPABILITY TIER - Two engineers with the same tenure, and in the same role, can still contribute very differently. Some are reliable operators - steady, dependable hands. Others are force multipliers who unblock teams, become their "go-tos" and steady client relationships. When a force multiplier leaves, the ripple effects are bigger - so the weight should be higher.
You can think of more dimensions (for e.g. bus factor) , but let's keep these as of now).
Now let's assign some weights to these dimensions 🙂
TENURE — If the employee has:
0 — 1 year tenure, let the weight be 1
1 — 3 years - 1.5
3 — 6 years - 2
6+ years - 2.5
ROLE CRITICALITY —
Junior engineer, Individual contributor, Delivers modules - 1
Senior engineer, Mentor to junior engineers, Delivers features - 1.5
Lead Engineer, Mentor to team, Client SPOC, Defines tech roadmap - 2
Architect / Engineering Manager / Top leadership - 2.5
CAPABILITY TIER —
Reliable operator, safe pair of hands - 1
Force multiplier, team's go-to - 1.5
Now let's come back to the example of the 5 exits.
Assume that amongst the 5 exits, we have
1 junior engineer; safe pair of hands; 6 month tenure — Their weight will be 1 x 1 x 1 = 1
1 junior engineer; go-to person; 8 month tenure — Their weight will be 1 x 1.5 x 1 = 1.5
1 senior engineer; safe pair of hands; 2.6 years tenure — Weight = 1.5 x 1 x 1.5 = 2.25
1 Tech Lead; go-to person; 2.2 years tenure — Weight = 2 x 1.5 x 1.5 = 4.5
1 senior engineer; safe pair of hands; 4 years tenure — Weight = 1.5 x 1 x 2 = 3
Therefore, the combined weight of the 5 exits = 1 + 1.5 + 2.25 + 4.5+ 3 = 12.25 !
So if you calculate the Weighted Attrition Rate, it is (12.25 * 100) / 48 = 25.52%, which is much scarier than the 10.41% attrition that we saw as per traditional calculation 🙂
But that's the whole point! This number denotes the severity of impact that those individual exits have had on your organisation.
This will make you push for stronger retention measures. Conversations will change from "We had 5 exits" to "We had an equivalent of 12+ exits!"
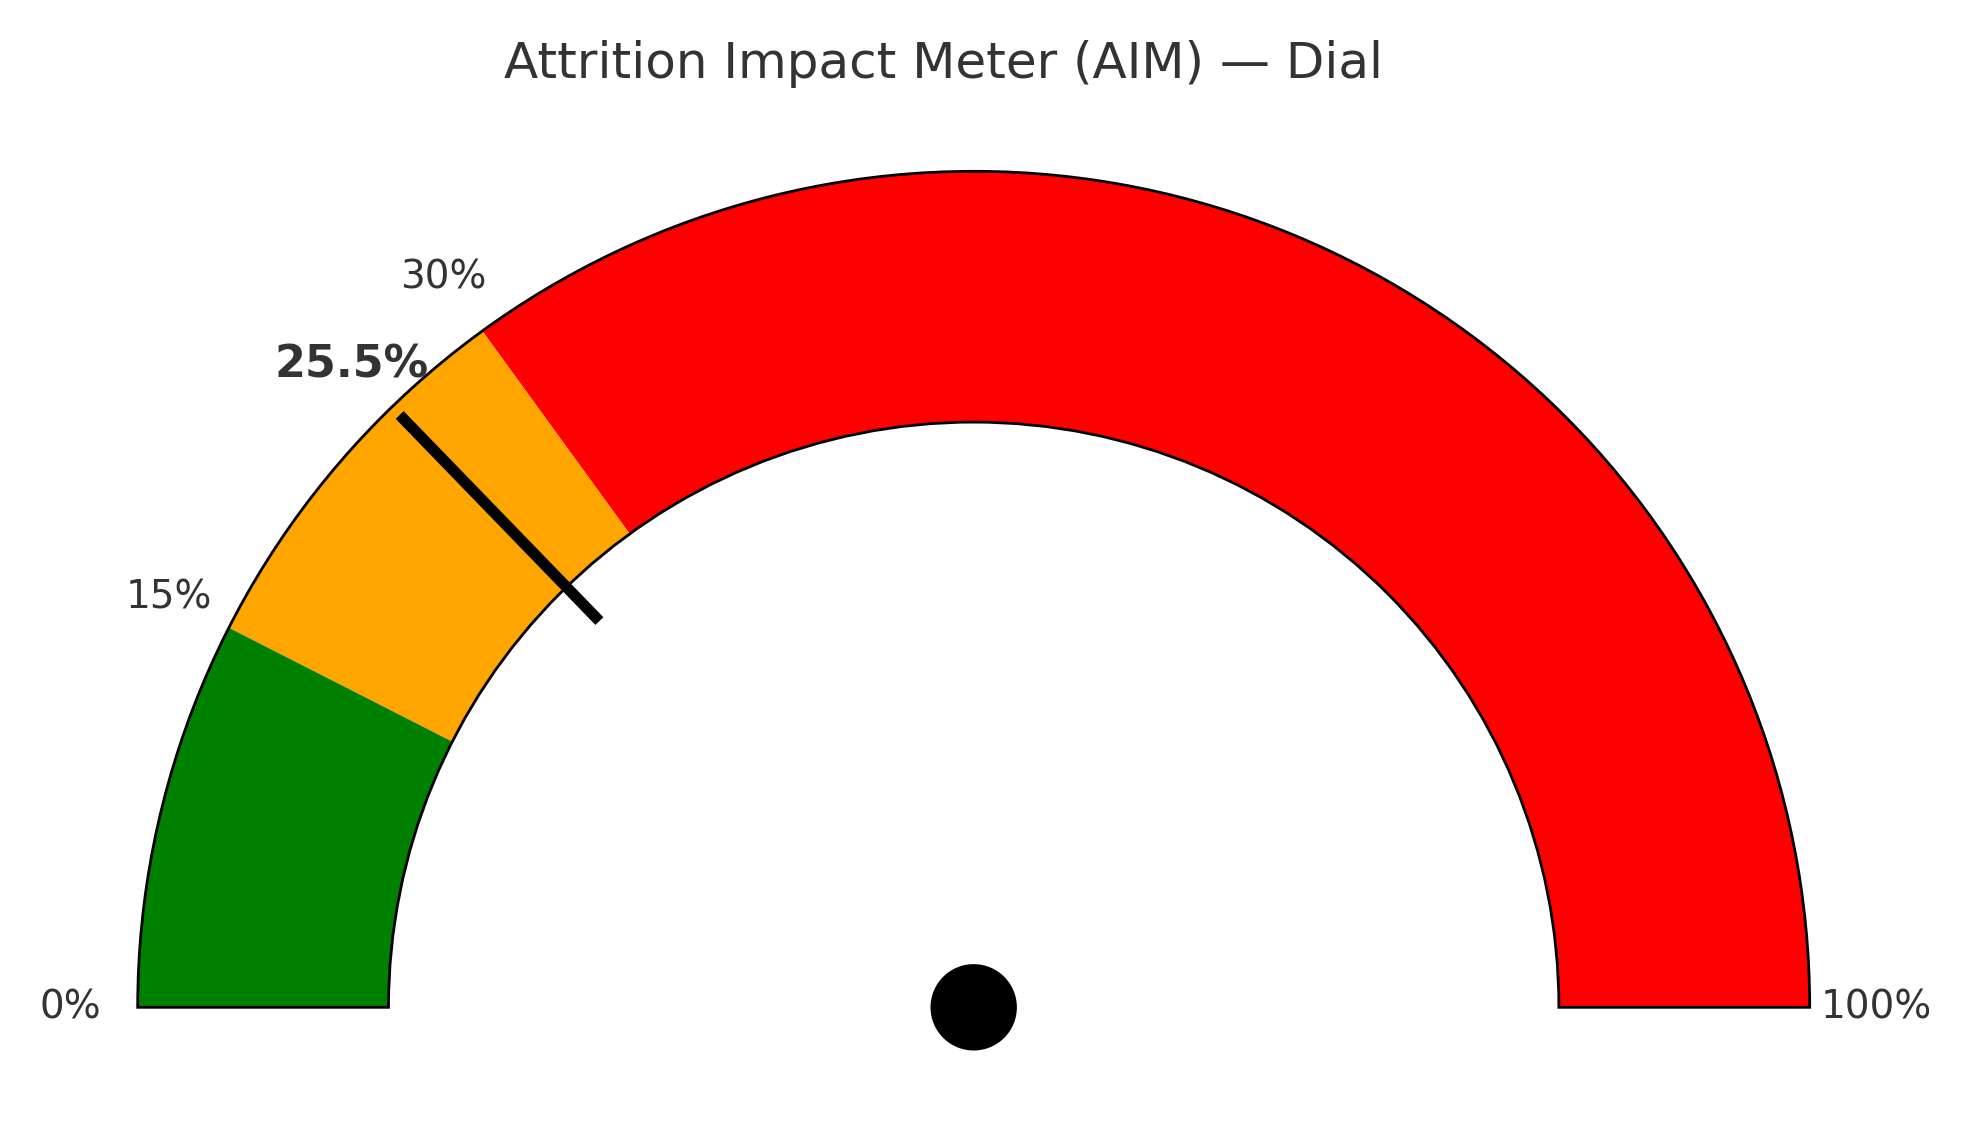
Now we can build a simple colour coded Attrition Impact Meter (AIM).
If the weighted attrition rate is less than or equal to 15%, we are Green 🟢 ✅
If it is between 15 to 30%, we have an Amber alert! 🟠 🔥
If it is above 30%, we are Red 🔴 And Red rhymes with dead 🙂
If you want a mathematical formula for this calculation, use
AIM % = ( Σ weights of voluntary exits / Average Headcount ) × 100
where each exit’s weight (wᵢ) = (Tenure multiplier) × (Role-criticality multiplier) × (Capability-tier multiplier), wᵢ ≥ 1.
Make this Rubric yours
This is a framework, not a rulebook.
You can define more Dimensions than the ones I have recommended (i.e. Tenure, Role Criticality, Capability Tier). There could be some interesting dimensions like - Time to Replace, Bus Factor, and more 🙂
You can choose to assign different weights than the 1 -> 1.5 -> 2 -> 2.5 progression I chose. But make sure that you do not give anyone a weight of less than 1. Because every voluntary exit has a baseline impact. Higher-impact exits push the number up; lower-impact exits don’t push it down.
You can define what range is Green, Amber and Red as per your discretion.
So where will AIM help
It will help the People team leverage data to push for stronger retention measures.
It will acknowledge the unique value that each member brings, rather than reducing them to a "headcount".
If AIMs are measured per quarter, then the quarterly AIM trends from previous years can help plan better for high attrition periods in the current year.
If there are team members whose exit can trigger high AIMs, delivery teams can prioritise succession plans or shadowing to improve the Bus factor.
If there are AIMs spiking under a particular account, or manager, it would call for a timely intervention.
Companies can focus more investments in L&D, and recruitment for the roles / teams where a churn could cause the biggest AIM spikes.
These are just off the top of my head. I'm sure there will be more areas 🙂
In Conclusion
The standard attrition calculation tells you how many people left. AIM tells you what you lost.
My recommendation is to keep the standard attrition calculation for benchmarking your company against the industry trends. But use AIM to prioritise action.
Pilot it for one quarter, tune the dimensions and weights, and you’ll change how you plan, budget, and staff.
Join Mayank on Peerlist!
Join amazing folks like Mayank and thousands of other builders on Peerlist.
0
3
0